Last Friday, very late in the day we opened some AAPL calls in addition to a longer term AAPL equity long that was in place, the calls meant for a short term move and the equity long meant for a longer term (Bear market, counter trend rally in AAPL specifically). Monday the Call position was closed and open about 2 hours total for a +50% gain- the typical hit and run position that I prefer at this point in the market.
As you know, I intended to keep the AAPL equity long open despite a probable pullback, however a few charts in the 10-15 min timeframe didn't hold up as well as I had hoped and decided that, in my view that AAPL long equity position at best would be opportunity cost and at worst a loss of all gains and a lot of open risk with no real good reason to have it exposed.
As AAPL has progressed since closing the long equity position this week, I've even seen some signals developing that suggest there may even be a worthwhile Put position, I don't think an equity short itself would have the profit potential to make it worthwhile.
I want to show you this just in case an AAPL position comes flying out like a put, as you might be surprised as my opinion up to now hasn't been along those lines at all. Of course this has implications for XLK, TECS and the NDX/QQQ.
This is the long term bear (primary trend) in AAPL, 1 day. Ultimately I don't think AAPL's primary trend is done on the downside, but for the intermediate to sub-intermediate trend, a counter trend bear market rally has seemed like the highest probability as we have noticed something positive building in AAPL since about April.
This 4 hour chart is still VERY strong, not as strong as a 1-day, but very strong. TThis represents the counter-trend rally, you can see where there was accumulation at the April area and again at the June area with a lot of psychological games around that triangle.
This is the 60 min chart, not as strong as the 4 hour, but still VERy respectable, it shows accumulation from the June lows as well as a positive divergence in the trend.
The shorter term charts represent shorter term trends unless they migrate to longer term charts. My initial concerns with the AAPL long equity position was this 10 min chart and whether it could stay in line or go negative, it went negative and I decided closing the long equity position made the most sense.
The 15 min chart should be making new 3C highs if there was confirmation, instead the 10 min chart's weakness migrated to the 15 min and from there...
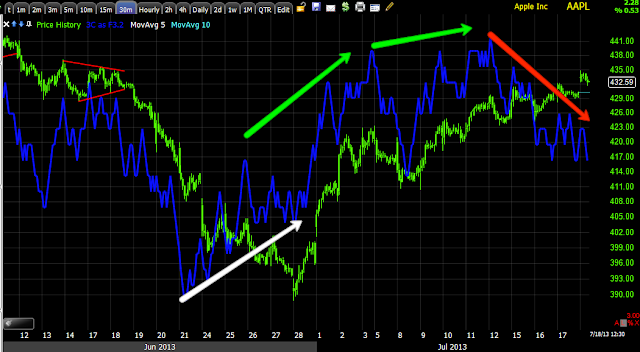
Now even the 30 min chart is negative. I definitely would not hold a longer term AAPL equity position right now, but I do think it will be a long position after a pullback and accumulation, but that's still some time away and far from confirmed.
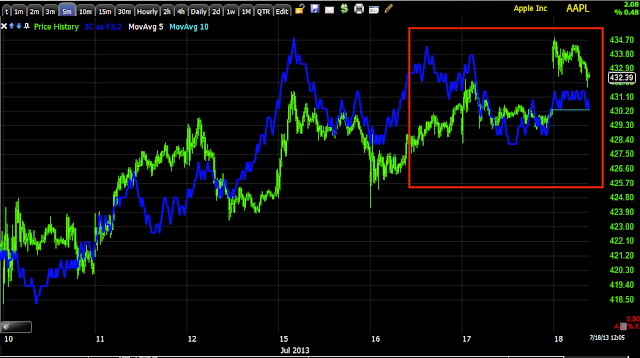
The intraday charts are now where my interest is as far as a Put position, the 5 min above is negative in this area as I'd expect, but not a great timing trigger for options yet.
This is the 3 min chart, it is weaker than the 5 min as it should be.
This is the 3 min chart intraday. For an option/put position I'd want to see price rise from here or at least hold flat and a deep intraday leading negative divergence develop on the 1-5 min charts , if price can hold up as that happens, all the better and may be a pre-requisite of a position.
If you were thinking about a swing type trade, my Trend Channel set to 60 mins has held this entire recent move, the pop of price on the upside looks bullish, but as you know it's normally a red flag (early warning). The break of the current channel is a 60 min bar closing below $430.00 at the moment which is also a whole number and I'd think would be an excellent place to expect stops to congregate.
I prefer a put on AAPL intraday strength and 3C intraday chart weakness (VERY OBVIOUS weakness), but if you are thinking about an equity type position, < $430 seems to be the area in which the character of AAPL's recent trend clearly changes.
i'll set some price alerts.
Is interest rates about to start going up?
-
Yes, I know - it does not make any sense - FED is about to cut
rates...but....real world interest rates are not always what FED wants it
to be.
6 years ago


No comments:
Post a Comment