Before I turn in (I have a Dr.'s appointment at *:30, as usual for my back, but I should be back before the open) I took a look at the futures, it doesn't look like much is going on other than the Nikkei Futures up pretty well.
Nikkei 225 futures
I'm not sure if they'll be able to sustain or not though. I checked the first of the usual suspects for driving overnight risk, the AUD/JPY and it wasn't behind the move.
AUD/JPY has a small divergence and bump up, but it's not driving risk in Japan as far as FX goes.
Surprisingly...
The EUR/JPY is apparently driving risk as you can see above, but there is a 1 min intraday (night) divergence in place so I'm not sure how much longer this pair will hold out.
There's also...
The USD/JPY driving risk, it too looks as if a 3C negative divergence may bring it down overnight not too long from now.
Can the EUR/USD take over? It does have a positive leading divergence.
As far as single currency futures, here's what's GOING ON....
The $AUD single currency futures took a nose dive earlier on a 3C negative divergence, there's a slight positive, but not enough to do much with, the 5 min chart has no support so I don't see much coming from the $AUD. In fact I suspect by tomorrow we'll be seeing further deterioration in the $AUD.
The Euro (1 min) overnight has a slight positive too, but again I don't think it will take the Euro very far.
This is the 5 min Euro chart, it looks like after a small bounce the Euro has more downside to go, the $AUD looks worse than this.
The $USD ($USDX) though may have different ideas, it will be interesting to see how they play out as far as our oil (USO) short position as well as the expected gold and silver pullback from late last week that we started seeing this week (Wednesday).
The 1 min $USD chart looks like a slight overnight pullback, but the longer term...
5 min chart has a large positive divergence forming, note the small negative to the far right, that is the 1 min chart's negative divergence from above which tells me any pullback in the USD overnight is probably not pulling back very far.
Longer term....
The 60 min $USD looks to be working on a larger base for a move to the upside, hopefully this helps our USO/ (Short) / DTO (long) and brings gold and silver down like I wanted to see back to their accumulation zones.
As far as the Yen goes...It's no wonder the Yen crosses look like they're coming down, at this point I have to wonder which FX cross can power any market upside, it's not looking good, except for a very short term overnight move perhaps in the EUR/USD.
Yen 1 min
Yen 5 min
Yen 15 min...
3 positive divegrences, it doesn't look like a big rally for the Yen, but enough to pullback the EUR/JPY. AUD/JPY but maybe not the USD/JPY.
Crude futures (Brent) 30 min look like a trend to the down side is coming, I feel good about the August puts and better about the DTO long.
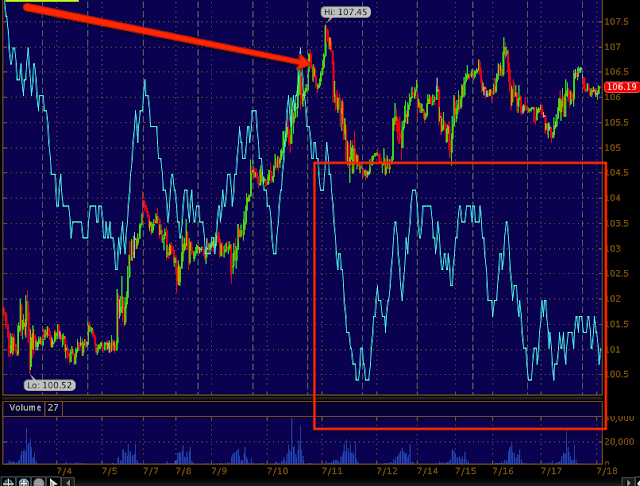
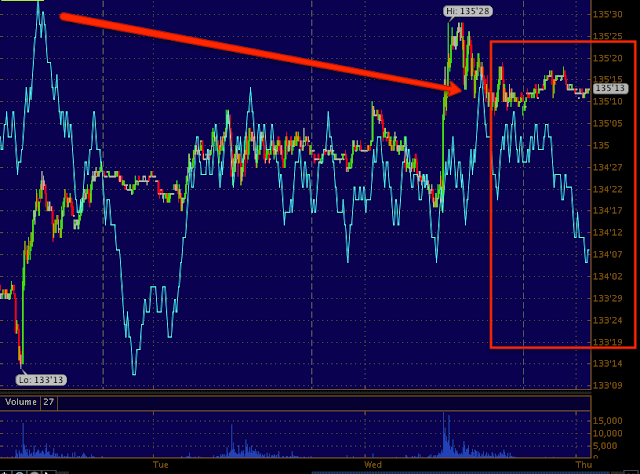
10 Year treasury futures are in a small triangle overnight, I wouldn't be surprised to see a head fake/ false breakout of the triangle to the upside, but after that both the 10 year and 30- year US Treasuries look like they are coming down, I don't think Bernie will be happy with that. If futures come down as I suggested with a few near term TLT charts today, then that may provide some upside arbitrage catalyst as the algos read treasury weakness as a risk on trade, still it's pretty near term weakness and mostly in the 10-year over the 30 at this point.
I still think something bullish is happening in the 20+ year treasuries and they'll see significant upside in the weeks and months ahead.
Leading negative divergence in the 10 year UST futures / 5 min chart
The 30 year 5 min chart has a smaller negative divergence. Very short term (like overnight), I think we could see a false breakout of the 10-year that fails to the downside, that could bring a fast move down in UST's.
With a 4 hour 30 year 3C leading positive divergence like this, I think we should welcome any short term downside as a gift to get long TLT, I've thought something bullish was going on here bigger picture, as I said last night, one way to stop banks from taking losses on their unrealized gains (actually losses) on their treasuries is to create bond demand outside the F_E_D and how do you get people to move money from stocks to bonds?
This 30 year treasury 4 hour chart is a VERY strong timeframe for 3C and that is a VERY STRONG leading positive divergence, it appears someone is accumulating 30-year treasuries in bulk very quietly.
As far as Index futures, fairly quiet, here's the 1 min ES chart with a very slight positive divergence on the 1 min after a gentle slide lower.
S&P E-mini futures.
As you saw in the averages today, there's a ton of damage where it counts, only the short term charts that started a short term bounce or accumulation yesterday and tried to work in to it today, need to go negative and all timeframes will align negative which is the point in which you back up the truck. Until then, I'm just looking for high probability/low risk positions as they come available so we aren't scrambling around at the last minute.
See you in a few hours.
Is interest rates about to start going up?
-
Yes, I know - it does not make any sense - FED is about to cut
rates...but....real world interest rates are not always what FED wants it
to be.
6 years ago


No comments:
Post a Comment