There are some VERY interesting additional Futures charts, many of which didn't fully develop until the overnight session, some surprising, some mysterious, just about all interesting.
There are a few changes to the Index futures charts overnight, I don't give them a lot of weight generally speaking as it was 1 night and the start of futures trading with several important markets not being open, but on the 30 min charts I tend to give them a bit more credit, although the moves are smaller there, they are in the same direction which is deterioration as was made clear last night from a formerly "in line" position, the median line between shorter term negative charts in the 5-15 min range and the leading positive charts in the 60 min to 2 hour range.
The ES 5 min chart which holds more weight with me for near term (
in this case, "near term" meaning likely early this week, as early as today) has seen more deterioration overnight, it's really just the natural progression of the divergence.
NQ 5 min however has seen true deterioration overnight, this is worse than "natural progression" of the divergence.
TF (Russell 2000 Futures) 5 min chart has also clearly seen a more negative trend since last night.
Last night's post,
"The Week Ahead" called out the obvious negative divergences and Leading Indicator dislocations from Thursday/Friday last week,
but more importantly it called out a very recent change in the Index future 30 min charts which had been in line and therefore served as a perfect demarkation between the shorter term negative signals on 5-15 min charts and longer term positives on 60-120 min charts. The deterioration on the 30 min charts is not severe, but it is a clear change in character from the earlier, nearly perfect "in line" status.
The 30 min NQ chart has deteriorated more since last night's post.
As far as some other interesting futures, I don't know where to start... How about currencies...
First 10-Year US Treasuries Futures, last night you may recall that the short and long term charts were serving as confirmation for the Index futures above, generally the next leg in the market or trend being down and then followed by a strong upside move. There's a bit of a dichotomy in that the longer 3C charts tend to be the most credible as far as the main underlying theme or expected trend, yet common sense tells you , as with anything (where you will be in 5 years, a 2 week weather forecast, etc) "the further out you try to forecast, the more unreliable the forecast becomes". This is true I'd say even of our longer term forecasts, but not because the signals are not real, meaning the longer term trend has a positive signal because there has been serious positive movement in that trend's timeframe, but rather the probability is higher smart money changes their mind, especially with the higher volatility, the unstable geo-political and economic environments, etc.
Did you know as of now (Q2 just ended) the average hedge funds performance is underperforming the SPX by 80%!
In any case, for now we have good confirmation and that becomes the most important part of any forecast, confirmation, as much as you can get .
10 Year Treasury Futures
1 min is basically in line on a move to the upside overnight as 3C suggested,
a "Flight to Safety Trade" indicating the next leg in the market is down.
15 min As you can see, there has been a massive gain in the Leading Positive Divergence here just since last night. It seems the "Flight to Safety " trade has suddenly become a very hot issue. However market correlations haven't been spectacular, in fact until late last week they weren't even good among flight to safety assets and risk assets, perhaps this is the start of a change.
30 min has also seen a huge leading positive move. It is for charts this long to move this fast and intensely, to me it always is a signal that shouldn't be ignored. Perhaps market indications will give us some back-up correlation in the next hour as we move out of the a.m. trade session which is filled with mis-direction.
30 year Treasury Futures
1 min is in line with the move to the upside as of this capture
15 min is seeing a huge leading positive move like the 10-year treasuries.
30 min as is the 30 min chart. This is strong confirmation among treasuries, we'll see what the market averages have to say, we have good confirmation with Index futures.
As far as the other timeframes of 5 min and 60 min, both are in line with their respective trends (5 min up, 60 min down).
Currencies...
FX pairs are difficult to get signals on in any timeframe other than the intraday 1 min, rarely they offer longer signals, the single currency futures do offer a much more detailed look in multiple timeframes, but we'll stick with the immediate future for now.
EUR/USD 1 min the pair is shown with the European opening at 3 a.m. (green arrow on the time axis) where the pair was in line (green arrow on price window), however the pair has since gone to a negative divergence.
USD/JPY 1 min was negative at the post European open highs this morning, but is now moving to a positive divergence.
AUD/JPY 1 min was moving toward in line at this capture, I've checked it since and it is clearly in line with the move up for the time.
EUR/JPY 1 min is a bit more choppy right now, but the general tone is still toward a negative divergence.
Looking at the single currency futures, I found them to be unexpected in certain instances so I covered the charts that seemed most interesting and filled in the data regarding other timeframes.
Euro 15 min went strongly leading positive overnight, the5, 30 and 60 min Euro charts are also leading positive.
Yen 30 min continues to build a large positive divergence since last week, the 5, 15 and 30 min above are all leading positive, the 60 min chart is inline with it's trend which at 60 min is down.
AUD 30 min, another longer term leading positive divergence , this one not as sharp, but quite a bit bigger. The 1 and 5 min charts are almost in line with price action, but lagging just enough to make it a negative signal. The 15 minute, 30 min above and 60 min are all leading positive with the 15 min being the sharpest as it should be.
$USD 15 min has a deep leading negative divergence.
$USD 60 min has gone from a perfect positive divergence to an uptrend with perfect confirmation to a relative negative divergence; this is a weaker form, but on a very strong timeframe.
Interestingly, the 1 min $USD has a very strong leading positive signal which would suggest a fairly large base for the timeframe is being put in place for a fairly large reversal for the time frame.
The $USD has been largely in line or moving with the SPX which is the opposite of its normal correlation, HOWEVER the $USD has led the SPX in both of the last two significant reversals (the 6/19 head fake SPX move up was called a fake by the USD and the USD led that trend in the SPX down and the 6/24 bottom for the SPX saw the USD already leading the market to the upside).
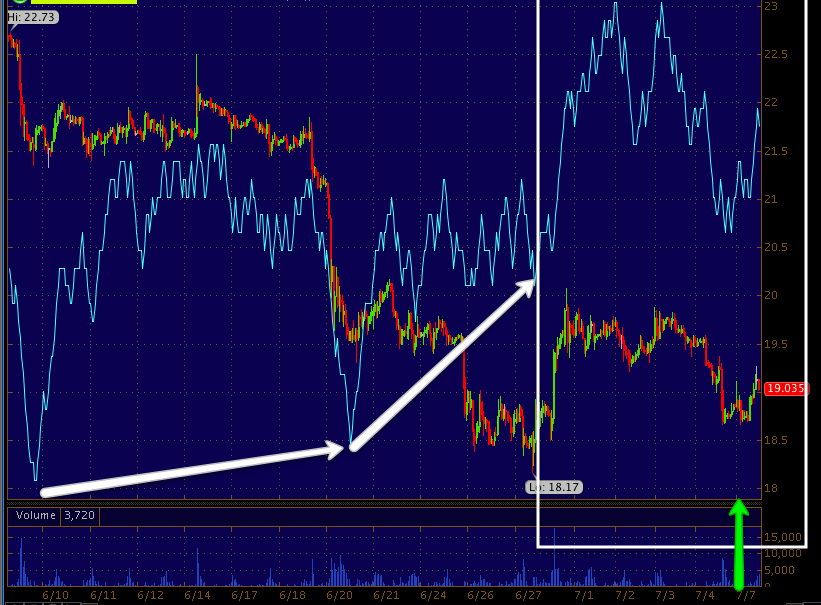
What is interesting is despite the overall daily trends moving together lately, the intraday trends have been acting as they should and trading opposite the SPX, it's hard to envision so here are two charts.
The SPY is the green price chart, the $USP is the red price line. On this 60 min chart you can see the two moving together directionally at the green arrows, but at any significant reversal the $USD leads, as it led lower before the SPX in yellow and led higher before the SPX in white.
 The more detailed 5 min chart of the same assets show intraday trade moving as the historical legacy arbitrage correlation would suggest, nearly mirror opposite each other, but only intraday.
Crude Oil...
I have told you about the USO negative divergence and my unwillingness to play it because of the fundamental situation on the ground in Egypt, however now the futures are really starting to take sides with USO and the probabilities of a move to the downside are growing.
Light Sweet Crude Oil Futures 1 min chart is perfectly in line with the downtrend this morning in oil, even on the bounce since this capture, 3c is moving perfectly in line with price.
The larger trend though at 30 mins has clearly transitioned to confirming the uptrend to starting a pretty serious negative divergence.
The other timeframes of 5, 15 and 60 min are all also negative and leading negative.
Precious Metals
This is the Gold 30 min futures chart leading positive and looking like a larger "W" base. The 1, 5 and 15 min charts suggest a pullback, the 60 min is still in line, but may change with this 30 min positive.
I'd say any pullback in Gold will likely be a strong long entry with the 30 min chart moving like this.
Silver futures 60 min shows a long, strong base which I have pointed out and love.
The other timeframes of 1, 5, 15 and 30 min are either in line as most of the faster timeframes are, just like SLV or slightly leading positive as well like 15 and 30 min.


No comments:
Post a Comment