I'd think maybe the Egyptian situation may be causing some of the intraday tension back and forth, but it's not reflected in oil, this honestly just looks like sellers are stepping in on any bit of strength, they did it on the open today and then as we started to form a little "U" and
Leading Indicators don't look good, even if we did get a move to the upside, Leading Indicators in my view confirm that the right play is not to try to play an upside move, but to use it to set up or add to positions (short the market).
CONTEXT for ES has also seen the model drop like the SPY Arbitrage model, now the ES model is saying ES is 13 points rich compared to other risk assets.
*All Leading Indicators are compared to the SPX unless otherwise noted
HYG vs the SPX, the same negative dislocation in credit is seen today, however on an intraday basis, it seem like credit has been a supporter,
again this only confirms the strategic play here to allow any potential upside to be used to short in to, not to try to play the upside which seemingly can't get a leg up.
HYG intraday vs the SPX (zoomed in tight).
This has obviously helped any of the arbitrage algos as HYG is a SPY arbitrage asset.
The thing not seen in price is the decay in HYG's 3C chart, that's more apparent on the chart above this one in the dislocation.
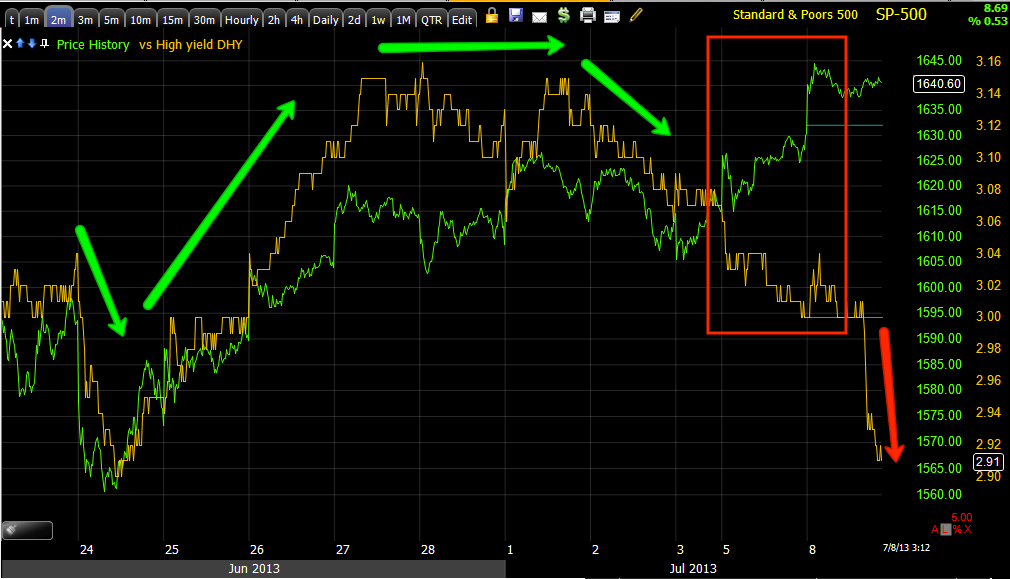
High Yield Credit is the less liquid one and the one I always say will panic before HYG, look at this chart of DHY confirming the trend of the SPX and breaking off late last week as pointed out again last night, then today it was full-on panic.
This is HY Credit intraday, someone wanted out immediately.
I suspect when they saw the attempted move today had no legs or was struggling as bad as it was, they bailed.
Look at the normal correlation of VXX to the left and then today's,
as 1 of 3 SPY arbitrage assets, it's pretty clear HYG and VXX were used to try to drive the SPX/SPY up based on arbitrage correlations alone as you saw the SPY didn't have much more, not even a positive 2 min intraday chart.
FXA intraday ran along with the SPX, however again confirming the strategy considered for today on any move up, the slightly longer chart shows the probabilities once again.
Here's the AUD a little longer view vs the SPx, the trend confirmation and even the positive divergence at the 24th are long past,
this market really looks ready for that move down, the next leg we expect.
The Euro intraday also seemingly supportive, but...
the wider view is even worse than $AUD, confirmation short term is long gone.
Yields which are like a magnet for equities reverted to the short term mean last week as shown last night and now they are dropping, they'll pull equities toward them and longer term they are severely dislocated.
This is the sentiment indicator FCT (
not retail), it too,
very much like HY credit seemed to give out once it was obvious the market was struggling even with the SPY arbitrage on its side.
HIO is severely dislocated from the trend as seen last night, the next leg is down.


No comments:
Post a Comment