Well today was just about what I expected, yesterday there were no short term signals for any kind of strength as I said in a previous post so you look to the trend if there's no other information that's standing out and that trend is now 9 of the last 11 days with a red close in the SPX, "Changes in character precede changes in trends".
Don't get me wrong, I am and have been and have been showing you the charts as to why I am bearish and honestly these last 11 days are NOTHING! However, the best way to enter position is with high probability set ups, GOOG was a strange one that stuck out last Friday so I went with it and despite all that happened in the market today, the calls here were worth 30% for a single day,
however that's not where my real interest lies in GOOG.
GOOG 30 min positive and many others made this worth a shot and even though the market looked pretty ugly, the 3C signals held up, GOOG was a long.
I'd usually have taken the early momentum, but since GOOG has some longer term positives I decided to wait.
This is the intraday 1 min chart, GOOG almost saw some trouble, but bounced back in the late afternoon.
However my real interest in GOOG is short...
This 4 hour chart tells me if I can get near the $900 level, I want to start/ add to a core short here, the call trade is just hitch-hiking along the way.
I'm just going to throw some charts out there for you and hopefully give you a better feel for where we are which
in my view is still "Patience mode" and let the Core Shorts work for you.
THE LAST FEW WEEKS I'VE BEEN CAREFUL TO SAY, NOT "WE ARE CLOSE TO THE BIG PICTURE", BUT RATHER,
"WE ARE IN THE BIG PICTURE NOW".
This is Clear Method price charting, but the small H$S I pointed out last week actually was just about perfect.
If you recall, I don't like shorting the break, either short the Head or the Right Shoulder, but not the break.
Too often shorts are shaken out on a volatility move above the neckline and that is where we'll find opportunities.
However, I think there's an even larger H&S in play and possibly one larger than this/This is good to know because it can help you set initial targets.
This is a form of volatility stop I've been messing around with for a while, not only did RSI go negative, but so did the VS.
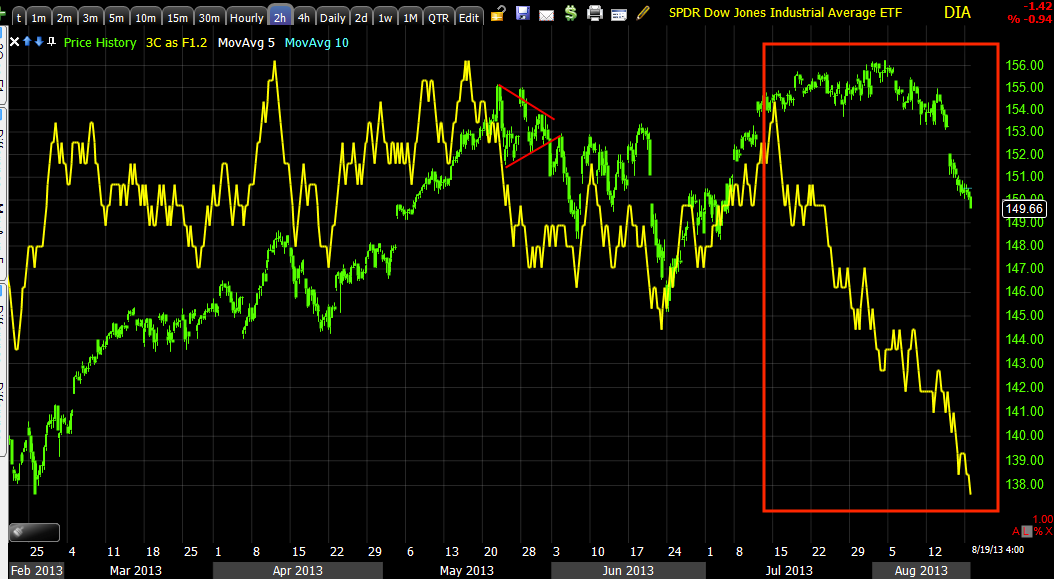
Because today was pretty slow on new data and because we are so often looking at what's right in front of us, I wanted to show you some "Big Picture" charts, it might help you decide whether you want to cover a short for a quick bounce or just leave it alone.
DIA 2 hour big picture,
there's no recovering from this.
IWM 1 hour leading negative at new lows,
I have seen very few charts come back from this, AAPL may be the closest thing to an example, but even it is not a good example.
QQQ 2 hour,
the longer the timeframe, the more serious the signal.
SPY 4 hour
Financials/XLF 4 hour,
so you know I want to be short here when I get an opportunity.
Tech 2 hours is another obvious target.
As for today, did it feel like a reversal day? No. Did it make some head way that could be used? Yes.
The spike up in HIO (sentiment indication) was unusual, especially with that late day downside.
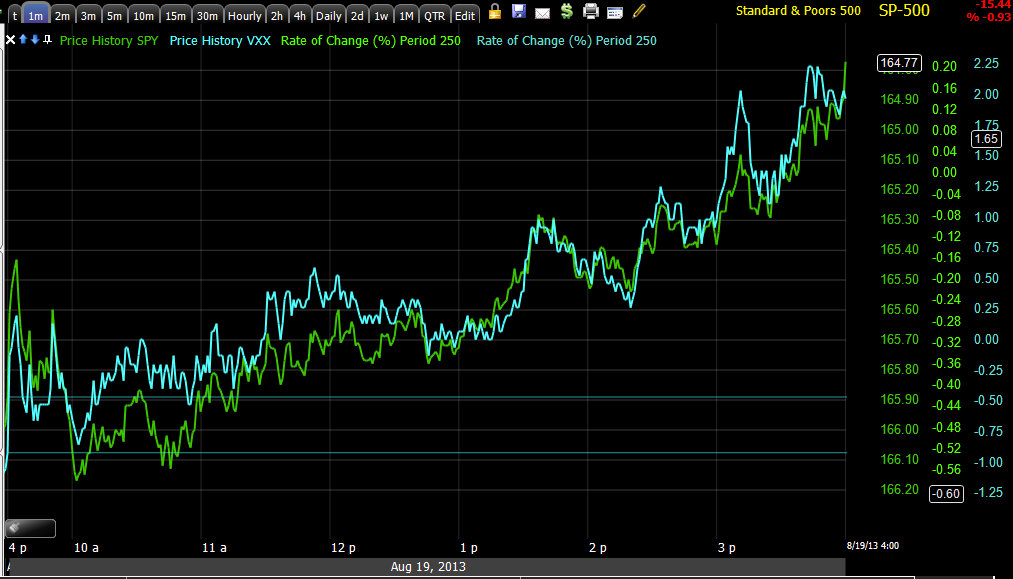
VXX really isn't showing the kind of bid I'd expect to see from a market in so much trouble.
VXX didn't even outperform the with the SPX, this tells me that traders are not buying protection like they have been and this is the time you'd expect to see the most.
correlation

This is the 4 hour "Big Picture" VXX, remember the market moves opposite the VXX.
In a possible twist from last night's "No engine to drive a bounce", today the relatively well,
if the Yen loses some ground the USD/JPY pair will do the work, other pairs like the AID/JPY got killed today, but the $USD held its ground.
The Yen shooting up around 2 pm and the AUD/JPY as well as USD/JPY falling at the same time with the market smelled a lot like the AUD/JPY carry trade was being closed (whatever is left of it).
How things held up at the end of the day was important, that's why I like to see motion, commodities held up well here and I think a large part of that was the relative stability in the $USD.
However, as a risk asset, commodities are now giving the market a leading positive signal.
XLF had some strength last week so seeing the 5 min chart grow was not a big surprise.
XLK (Tech) held up better than appears as well, especially at the EOD.
Check out the 2 min trend in the DIA and the notable difference today.
The same can be said of the 1 min IWM, still lagging the SPY/DIA, but showing some change
The Q's still look as bad to me this week as they did late last week, they gave up quite a lot off the intraday highs and there no 3C activity in to the EOD.
The SPY min also changing character a bit. It's these changes in character that give us early warning.
Some individual charts...
AMZN has worked out great so far with shorts >$297.50 and the psychological $300, still I think AMZN has the potential to be a big winner for us so I would welcome any opportunities to add or establish a new AMZN short, the short term chart looks like it may be ready to take a break from the downside.
The 10 min chart looks even better, now we're getting in to GOOG territory.
As far as why you might want to short AMZN IN TO ANY PRICE STRENGTH, this 4 hour chart should answer the question/
GOOG looked like a great Call position Friday so I went for it, this 30 min positive helped a lot, but in my view, with a stock as big as GOOG, this says something about the market near term as well.
I decided to hold the call today and got a little worried mif-afternoon, but GOOG pulled itself back together at the EOD.
I think any decent price strength we can get from GOOG will set up a decent short position, this is a 4 hour chart.
USO 60 min chart, this one has been gnawing at me because I'm pretty sure it will make for a great swing type short trade, the irony is we'd need USD/JPY strength (USD strength) to push the market up short term and USO down. I still haven't pulled the trigger yet.
USO intraday seeing some late day strength.
As far as the USDJPY currencies, there's still no decent signal to try to predict the pair, they both look very similar.
As for futures tonight (I'll check them again later tonight), ES is still holding the 5 min positive and NQ and TF are holding the 15 min positive.
ES 5 min positive from yesterday, it looks like nothing bad happened at all, this suggests accumulation in to the lows today.
We really are in a no lose situation, if the market heads down our core shorts are making money, if the market bounces we can make money on the bounce and enter new shorts because we know where the highest probabilities (market any way) lay.
This is a good position to be in.


No comments:
Post a Comment