I would prefer today wasn't an options expiration day, as you know the market tends to stay pretty close to pinned until about 2:30 when the brokers start calling asking what you want to do with your contracts, they tend to wrap up around then and the market has an hour or two of playtime.
In any case, I have a put position here, I'm thinking though of starting a core short position, phased in to with maybe 50% in the area now.
This is the daily of IYT, it has what would be a head fake move above a recent range, it has (thus far) a bearish Harami (or inside day) reversal candlestick pattern and it is showing the negative divergences above the range that we look for in a head fake move.
As far as proportionality in the reversal process, this most recent move was much more parabolic than the last so I'd expect it to turn down a bit faster as well.
The risk:reward proposition at this area looks very attractive. I ran a quick volatility scan / stop on a 60 min chart of IYT and came up with a stop about $3.50 higher from here, that's actually VERY tight and I prefer a wider stop on positions like this, it can be tightened up later, but there's typically a lot of volatility, even if it ultimately goes no where. That stop also would be on a closing basis, but again, you can have a 10% stop and as long as you correctly position size it, still only have a half percent or 1% overall portfolio risk.
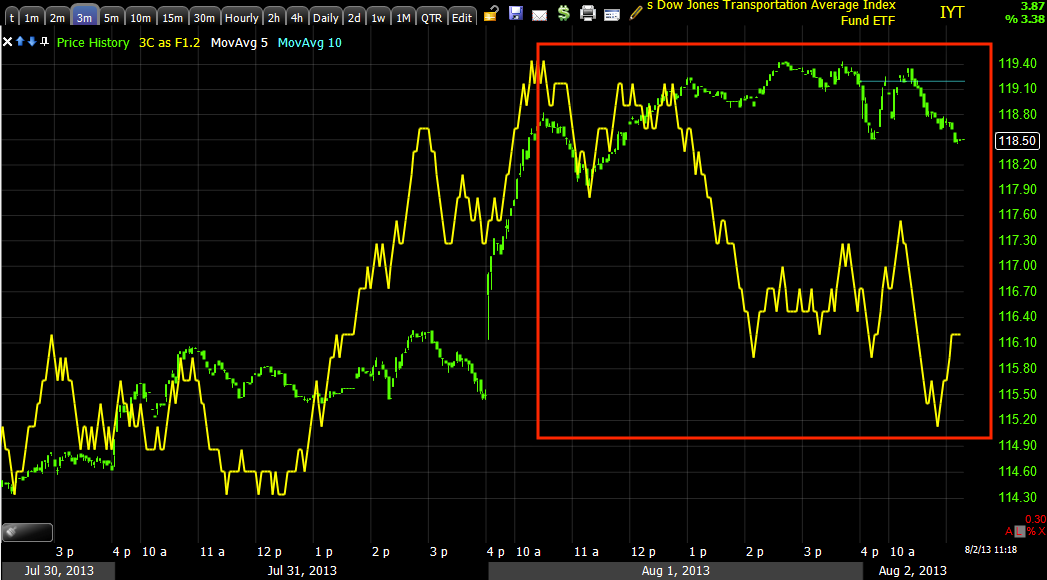
The 1 min chart continues to degrade and in the range I was hoping IYT would hold up in to. On a fractal basis as we see the same concepts on daily charts as we do on intraday charts, a move above the range intraday would be an interesting entry, if it does happen (and I'll set an alert), I'll check it too for a head fake move, these happen on nearly all reversals, it doesn't matter which way or what timeframe.
The 3 min deteriorating more
Same with the 5 min and this is all in a VERY short period on yesterday's run.
The bigger picture 15 min chart shows where the accumulation to make a run above the previous highs was, it was strong, but limited in terms of length, no matter how strong, there's still only so much volume traded per day.
This is the big picture, 4 hour chart. There was good upside confirmation, positive divergence sending IYT higher and then things went wrong here, a large leading negative divergence at a new leading low.


No comments:
Post a Comment