This will hopefully put an intraday divergence in to perspective for you. For late, please concentrate on the 18th in the charts that show it.
Most of you know that I'm not a big fan of leverage, but I do believe in using the right tool for the job and in many cases when we have a good signal, but the duration of the trade isn't long enough to make the risk/reward ratio worthwhile, leverage often is the only way to make the trade work, that changes as we get in to a more certain , trending market. The point being, you know that I'd normally have taken the +22% gain from yesterday's late afternoon XLF puts by now, I'm so unconcerned by this intraday positive (maybe a gap fiill) that I'm not even taking the gains from the XLF put because I believe it will do much better.
It's hard to explain and weight the information I'm giving you without knowing what I know about Friday and that is very hard to summarize beyond what I already posted, it will take some time so beyond the earlier post with links to last Friday, I'll have to get the full story in after market, but suffice it to say, on Friday when it was said, "it looks like the market knows something we don't and it doesn't like it", it did.
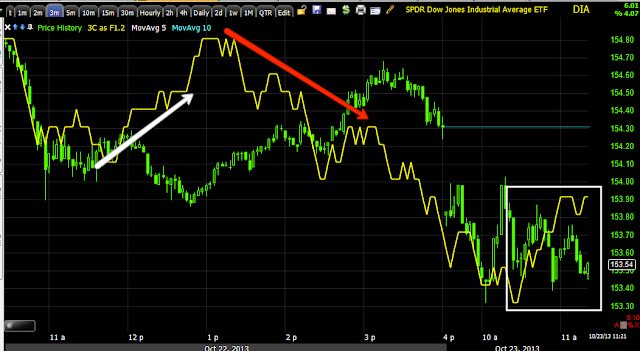
DIA 3 min with a slight positive divegrence out to 3 mins, this is intraday, but a gap fill would be an easy target, often an initial shakeout of new shorts is on the menu too.
This is a much larger view of the DIA, but one that shows how much distribution went in to the last run. The price above the orange trendline is a head fake move before that top reversed down.
IWM 1 min has its head fake move from yesterday above the yellow line, you can see on this chart how 3C's character started deteriorating at the 18th. We have a small positive "relative " divergence which is the weakest kind, it's within a larger leading negative as 3C is leading negative since about the 21st here. In other words, the current positive can move the market intraday, but it has a sort of roof on the move in the stronger leading negative. Nothing moves straight up or down, it's a series of corrections, pullbacks, gap fills, etc.
IWM 15 min chart shows like the DIA just how much distribution was in this last leg, but again I don't think it had anything to do with the actual level of the averages as we are not near window dressing, it was as I initially suspected, more of a utilitarian move to get other assets in to position.
QQQ 2 min leading positive...
And the same chart zoomed out to the trend view, so you can put that in perspective.
SPY 1 min leading positive
And the 5 min chart leading negative, again for perspective.
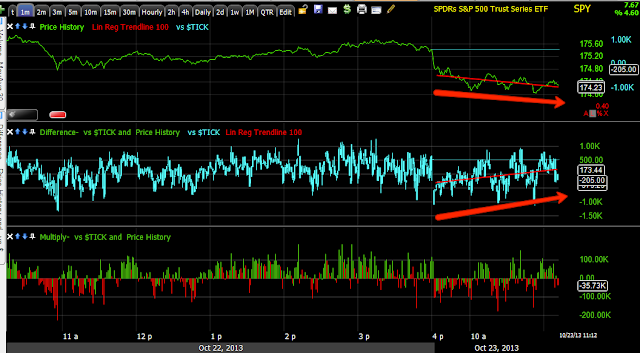
This was the TICK chart earlier, I'd expect a break above the channel when a move is about to start.
My custom indicator for TICK is meant to lead and it is hear if you look at the SPY and the TICK linear regression lines.
Index averages.
ES with a 1 min leading positive divegrence.
NQ with the same
TF with a weaker, but still intraday positive-all of these are 1 min. I didn't want to include every longer chart so just as a reminder...
The TF (R2K futures) 60 min with the reversal process up and down and the head fake movers in yellow, the leading negative on this very strong chart (60 min) really kicks in at the 18th.
So I'll hold current shorts, I may add to them or it may be an opportunity for you to start some positions if you didn't already and want to, at a better price point with less risk.
Is interest rates about to start going up?
-
Yes, I know - it does not make any sense - FED is about to cut
rates...but....real world interest rates are not always what FED wants it
to be.
6 years ago


No comments:
Post a Comment