I've been watching with a lot of interest as things have been a bit slow today, but I'll show you what we have and what I think of it, keeping in mind the F_O_M_C STARTS tomorrow and the policy statement is Wednesday.
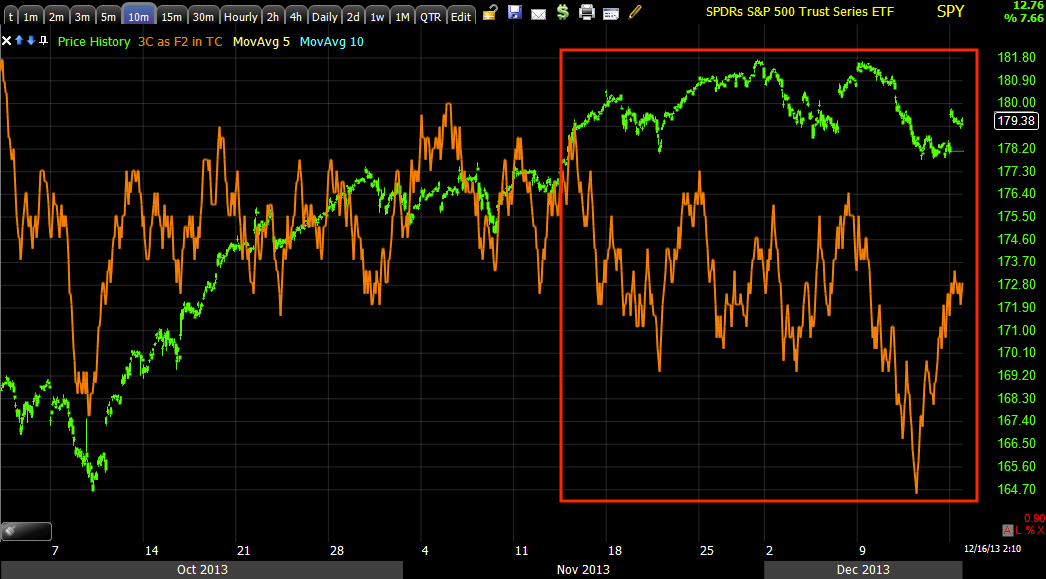
SPY 1 min, this chart has at least been in line or confirming for most of the day, just recently we have seen a little more positive leaning in 3C.
The SPY 5 min shows the original positive divergence that this bounce has sprung from, there's enough size to the original divergence to push the SPY further, I have some reservations about it lasting in to the F_O_M_C, I believe it is likely that the bounce will end before the policy statement. As to opinions about why a bounce here and now, I'll get in to those later when I have a little more supporting evidence.
There's always the chance of a leak and if that's the case, I'd expect 3C to show us that moving forward.
As mentioned last week, most of the divergences are contained to the 1-5 min period, this 10 min chart is still negative so the bounce positive was not strong enough to move the 10 minute chart which makes me believe this is more of a last hurray selling / shorting opportunity for smart money before Wednesday. Again, I need more confirmation to put probabilities on what is as of now, just an opinion.
IWM 5 min gives some sense of the positive divegrence and why we moved trading assets from shorts (took profits) and changed to longs for a short duration trade, looking to re-enter short positions. There's some loss of momentum on the larger chart, but not enough to cause concern about a downside reversal yet, but it does seem that they are selling in to price strength.
The 1 min chart here too like the SPY is showing some more positive intraday activity as before it was largely confirmation.
The QQQ 1 min also shows the same 1 min activity.
We also see that on the 2 min so the Q's may see some better relative strength moving forward.
The 5 min QQQ positive divegrence and currently in line.
VXX is a good timing trigger in my view, while I don't want to short it, I do want to buy at the right time, so far I see only in line at best intraday.
The 2 min chart looks like VXX could see some more downside or at least be pinned to the area, further suggesting the bounce in the market is not over or moving that way yet.
At the 5 min chart there is a positive in place so I do think VXX will see a strong move higher when this move shifts, this is another reason I don't want to short volatility, I think it will hold up better than the correlations suggest.
SPOT VIX's consolidation doesn't look like much of a consolidation at all, in fact it looks like it has considerable relative strength.
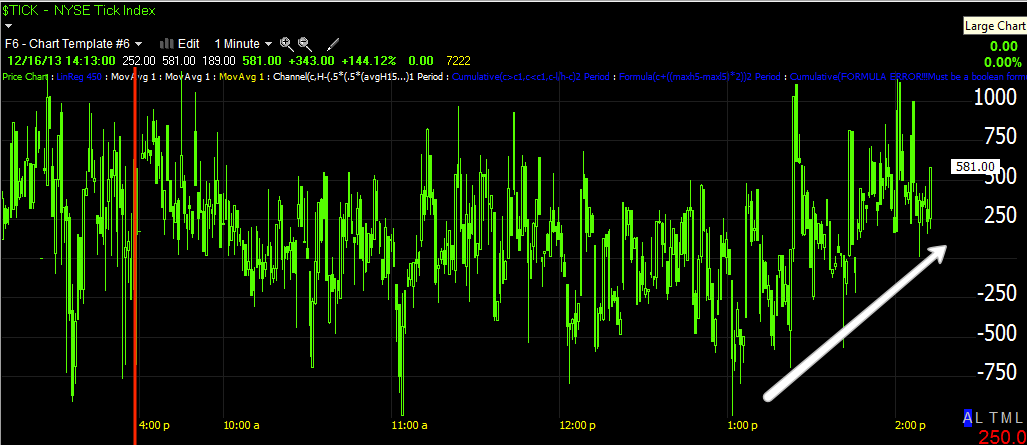
The TICK index is showing some late afternoon strength as the 1 min charts are doing above.
My custom TICK indicator vs SPY 5 min shows that there's no serious damage here yet and the move is still likely going to make more upside gains.
ES 15 min is one reason I took this move so seriously and moves almost the entire trading portfolio to a long posture.
On the 5 min chart there are some signs of initial distribution , although not enough to suggest closing positions and reversing course yet.
I think most of the lateral trade intraday has been because of the EUR/JPY losing strength, but it has recently turned to the upside which is probably why intraday charts are improving.
Finally, NQ 1 min again shows intraday improvement, again I believe this is because of the EUR/JPY carry pair's performance through the day.
I'll check a few more indicators, but this still looks like a "Trade management / Patience" market.


No comments:
Post a Comment