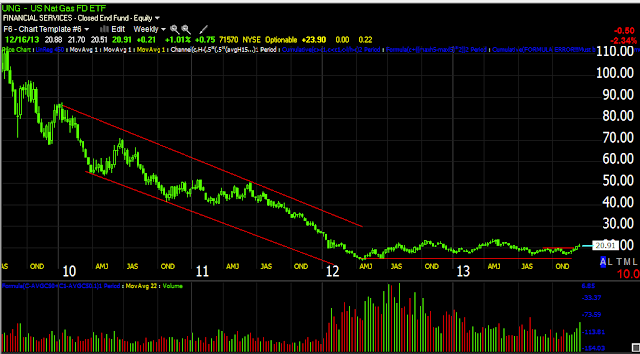
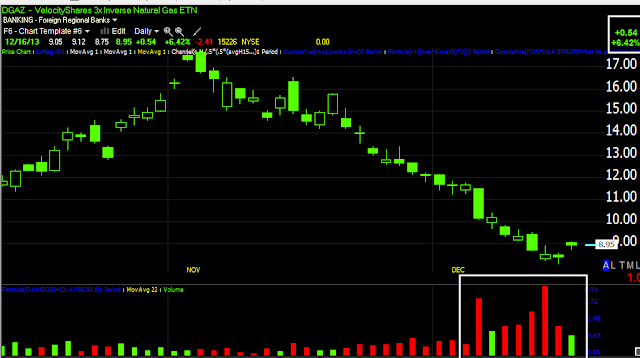
UNG is another long term long position that I really like, it had a recent breakout and as of last week I was expecting a pullback in UNG so I went with DGAZ as a way to play the UNG pullback (DGAZ is the opposite of UNG essentially with 3x leverage).
UNG, as expected pulled back today (or started it) and DGAZ is the #1 long from last week's trading longs picked, so far a 6+% 1-day gain. So whatever the UNG analysis, it applies to DGAZ inversely (opposite).
Even though we have a decent gain today, I never thought this would be a long duration or even medium duration trade (like the rest of the positions/market). Here's what we have thus far...
The first thing that caught my attention about UNG almost a year ago now was the change in character from a solid downtrend to a large or ever increasingly larger lateral trend consistent with a base. We've had long term trades, we've had +25% gains and traded around UNG and have done well, but the big picture trade hasn't emerged yet, that's a stage 2 liftoff out of this long lateral base and when that happens, UNG has the chance to be one of the biggest runners of the next year or two.
Here's the recent breakout, volume and the candle for the day were excellent, a strong breakout, but there were signals back then that we'd see a pullback, we just had to wait for them to become more defined. Note in yellow the bearish reversal "Hanging Man" candle and the increased volume, one of our concepts when dealing with candlestick patterns is volume confirmation, I'd say a candlestick pattern that has increased volume (bullish or bearish) is about 3 times more likely to work than one that has normal or average volume, so that candle was impressive.
This is what DGAZ did today, the recent surge in volume here is indicative of a change of character and a short term capitulation event, taken alone it may not mean as much, but with UN?G, they tend to confirm each other and raise the probabilities of our trade working.
My X-Over Screen is tricky in a lateral range like UNG has been in, but it is in a long signal, even now. The first pullback with this system on a new signal is almost always to the 10-day yellow price moving average, in this case though that "seems" a bit shallow to me, but for today I think we've seen as much as we are going to see, at least for now.
UNG's 30 min 3C chart has been deadly accurate in calling distribution and accumulation and the most recent pullback signal on a negative divegrence, but not one so damaging as to threaten the breakout.
The 5 min chart overall has been a good timing indication as it went from in line on the uptrend to negative recently, so far this morning's gap down "seems" to have some accumulation, this is what we want to see considering DGAZ is a short term trade, the longer term trade is UNG long and the accumulation of a pullback is EXACTLY what we look for to confirm our opinion about UNG and to allow a tactical re-entry long in UNG or for a new position, it allows you to get in at a better price with a better risk/reward profile.
However, I don't think this signal on its own is enough to tell us to close DGAZ long and re-enter UNG long, it's just a good sign that things are going as planned.
The 30 min DGAZ shows the same confirmation of the downtrend as UNG showed at the uptrend and shows the same positive divegrence where UNG showed a negative divegrence, again this is confirmation as these may be related, but they are two different assets completely with different leverage, different management, and most importantly different volume which is key to 3C's signals, so when we get confirmation like this, it's very valuable information.
The 5 min DGAZ was also showing the probability of a near term reversal was very high with a leading positive divegrence, compare to UNG's 5 min chart. What makes the chart more compelling is how it has been spot on correct about the negative that turned prices lower, the in line signal confirming the trend and the positive sending it higher, that's 3 for 3 and with UNG confirmation, it's 6 for 6 on one timeframe alone, this is how we build a case or discover a built case for a trade, the more confirmation the better, after all 3C is a reminder to "Compare, Compare, Compare".
DGAZ's X-Over Screen is in a sell/short signal, but will likely correct like UNG to the 10-day yellow moving average, that is where the first correction after a new signal usually ends up, in this case, I could see a little deeper correction toward the blue moving average, but then again with the F_O_M_C Wednesday, there may not be enough time.
For now DGAZ is just being managed, I'm looking for shorter charts to start changing and giving us a clue that the move is about to end, then DGAZ will be closed for a profit and UNG will be bought at a lower price.
So far, so good.
Is interest rates about to start going up?
-
Yes, I know - it does not make any sense - FED is about to cut
rates...but....real world interest rates are not always what FED wants it
to be.
6 years ago


No comments:
Post a Comment