It's no secret that I like USO / oil a lot for a position type move, longer than a swing trade, not quite a primary trend trade though, still worthwhile.
It's also no secret that I've been expecting a correction in USO, corrections can be price based as in a pullback or time based as in a lateral consolidation, I "Assumed " USO would see a price based correction, but that wasn't an assumption I had any grounds for, it's highest probability, but the only thing I had grounds for was a correction, as to what type, that's for the market.
USO is still acting well within the normal parameters of a correction, I'm not convinced it's a long again yet, but I am convinced it will be.
I've tried not to draw on the charts to allow you to look at the divergences for yourself, although I have given hints. Remember that the longer term charts are the highest probability and in a correction situation, the short term charts will usually be negative and we know the correction is ending as they start going positive and all new divergences (such as this positive) will start on the fastest timeframes and work their way to the longer timeframes like 2, 3 and 5 min.
Here's the charts for both the WTI based USO and the Brent based Futures, you'll find they have very similar signals at similar areas and timeframes.
USO 60 min big picture, there are several set ups here, the most recent is the most important and the highest probability.
The 15 min chart shows the initial movement warning of an upside move and then the movement warning of a correction and there's even a head fake signal in there just before the reversal to an upside move.
The 2 min chart is the intraday action, this shows you more evidence of a probable pullback, but also tells you something about where the pullback is in the process. Certain things will have to happen before the short term probabilities change and move USO back on track toward the longer term highest probabilities,
this is all very normal price action, there's nothing here unusual.
Here's the X-over system, it's hard to call a pullback to a specific average when the long signal just started.
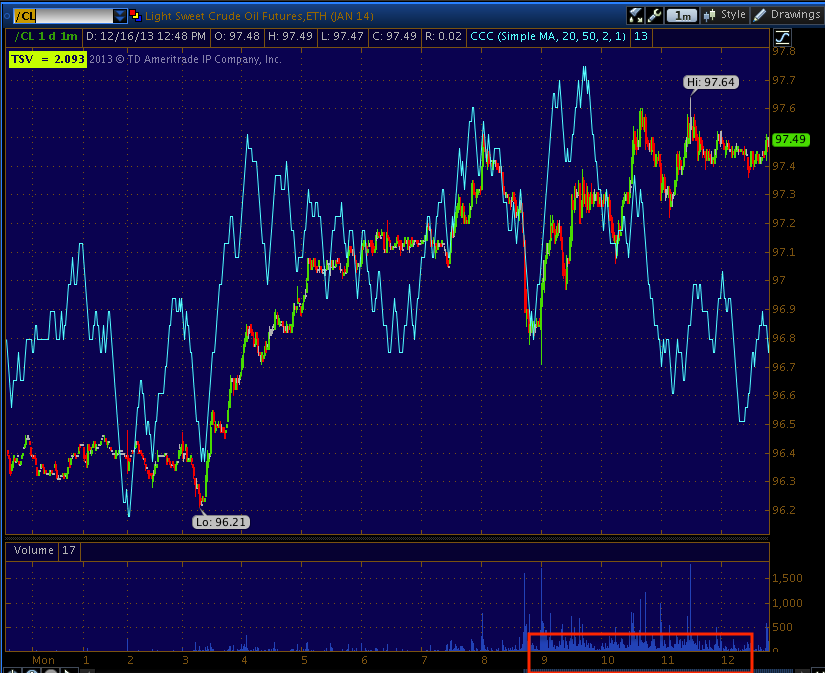
Crude (brent) futures.
intraday 1 min chart tells you something about where oil is in the pullback process, much like USO's 2 min.
The longer term 5 min chart tells you something about how serious or not serious the correction is.
The hourly chart is kind of an overview map of what is going on
And this 4 hour chart shows the changes in USO and the highest probability trend right now.


No comments:
Post a Comment