I wasn't going to post too much tonight, I wanted to see how the FX futures developed, but I have so many interesting charts all suggesting this is what I'd expect it to be, a dead cat bounce, that I just had to share them, even at this hour.
First you have to understand the NASDAQ's market maker and the NYSE's specialist perform the same function, they facilitate an orderly market (officially) , they also trade their own accounts, match buyers and sellers and fill large institutional orders for the stocks they make markets in, in exchange for their services they are granted a bunch of neat things that ordinary people can't do like naked shorting.
In case you didn't know, by law, they are the buyer/seller of last resort so if you have a market crash and everyone wants to sell and you have sentiment like now with retail at all time highs in bullishness and shorts near all time lows and the most leveraged retail trading sector ever, you don't have a lot of shorts out there.
A lot of pro traders with big positions will NOT go long a stock that doesn't have a healthy short interest, not because of what you might think, "The short squeeze", but because shorts are a future commitment of demand. When a market falls and no one wants to buy, just sell, the shorts facilitate a more orderly market as they take profits when they BUY TO COVER, they are buying which gives sellers someone to sell to and halts or mitigates the one sided supply only train.
Well in this kind of a market when there are extremes with no natural supply of future demand (shorts), it falls to the middle men, the market makers/specialists to fill those orders and become buyers of last resort so long as you place your order AT MARKET and are willing to accept whatever the spread is and it will be wide.
Considering the above sentiment dynamics and considering that early yesterday the NASDAQ100 went green on the year early in the day, it's conceivable the middle men had inventory at those higher levels before this happened...
This 5 min chart compares the EUR/JPY carry in candlesticks vs ES (SPX futures) in the purple line.
Note the carry falls apart and ES soon follows, but it had been moving up early in the day.
As an aside, all upside momentum seems to have halted tonight.
This is the USD/JPY carry pair which in conjunction with SPY Arbitrage (mostly the carry though) lifted the market... Also note upside momentum has fallen off.
By the way, as I suspected, SPY arb went negative.
I'll show you why in a bit.
In a situation like yesterday with few shorts to provide demand, the market makers and specialists likely had to take on a lot of inventory and likely already had some at the highs of the day which leaves their book at a new loss on the day (most likely).
So dead cat bounces often aren't about much more than the market makers/specialists trying to get out of that inventory at a profit.
In fact ES's VWAP pretty much stalled today right at yesterday's close, that's the Volume Weighted Average price and probably somewhere around the market makers average inventory price. Market makers aren't lonely traders trading in one stock, they are Goldman Sachs, JPM and others so they have the firepower, manipulative abilities to move the market and it's really easy when you are lifting a carry trade in the middle of the night when volume is super low, it can also be done with options to make the market look more bullish than it is, as Cramer calls it, "Fomenting" or creating a lie to create a new reality, but the most important thing is to do NOTHING THSAT IS EVEN REMOTELY HONEST" (HIS WORDS) Make sense?
In any case, as
I said last night, there was a Dominant Price/Volume Relationship that made it highly likely we'd have a higher close today (Tuesday).
"There was a clear Dominant Price/Volume Relationship today, Close Down/Volume Up which is the most bearish of the 4 possible relations, but also often signals a 1-day oversold event."
Tonight we had another Dominant Price/Volume Relationship, dominant in all of the major averages, but the same in 4 of 5, the Dominant Relationship was Close Up/ Volume Down which is the most BEARISH of the 4 possible relationships, only the Dow was Close Up/Volume Up which is the most bullish of the 4 possible relationships.
The dominance broke down like this (remember only the Dow was on its own...
Dow 20 stocks, NDX 60 stocks, Russell 2000 1064 stocks, Russell 3000 1571 stocks and SPX 266 stocks...
So we had a very dominant P/V theme and at Close Up / Volume Down, not only is it the most bearish, but it's the opposite of Monday's and often represents a 1-day OVERBOUGHT event and the next day often closes lower just as the P/V relationship called the close today perfectly.
The actual move to send the carry pairs higher started around 2:30 -3 pm yesterday, remember today we saw a bunch of very small positive divergences at the same time, I'd say they knew what they were going to try for, Goldman doesn't have losing trading days, they wouldn't allow their market maker to be stuck with millions of shares at much higher levels.
So lets take a look at some charts...
First the averages today...
IWM 1 min with that positive I mentioned at the lows, it was in line almost all day (3C price trend confirmation), but went negative in to the close.
IWM 5 min is still a mess, a ton of damage and today did NOTHING to fix it as today 3C is just as leading negative as yesterday,
so dead cat bounce? Yeah, I think so.
QQQ 1 min going positive for the year Monday and then the floor falls out as the carry trades are already falling apart. Today we didn't even get confirmation which likely means the market makers and specialists were selling their inventory in to higher prices and getting out of the trouble they got in to yesterday.
QQQ 5 min, like the IWM, no recovery of the damage from Monday or the last few weeks, months, even 2013; still leading negative divergent at new cycle lows for 3C.
SPY 1 min didn't actually go positive in to the close, it just moved in line briefly, although still in leading negative position so it looks the same here, distribution in to higher prices,
that's not how retail works, that's a hallmark of institutional money.
Also note 3C was lower today than yesterday, talk about distribution in to price strength and the concept, "Above all, price is deceiving".
Oh and long term, the 4 hour chart leading negative at the worst reading for the last year.
As for the Arbitrage assets which were there to help, but they couldn't do this without the BOJ and moving the carry pairs which can be done on a short term basis...
This is TLT vs the SPX (green) intraday 1 min, but I inverted the SPX's price so you can see the normal correlation and relative performance. TLT for the most part was in line helping the SPY Arbitrage early, but in the afternoon it started outperforming, thus the SPY Arbitrage model above went negative in to the afternoon (the 3 assets in the model are TLT, VXX and HYG, for it to work, TLT and VXX need to be down and HYG needs to be up).
All day I said and yesterday (Monday ) as well that TLT looked like it was going to pullback and it did, this helped the arb, but I think it's a natural and healthy pullback and TLT may soon be in buying position.
The EOD leading negative looks to me like an attempt to bang the close.
VXX vs inverted SPX price shows VXX was performing poorly early, thus the positive arbitrage early, but by the EOD it was in line a it should be and the arb went red.

VXX/UVXY also were showing accumulation in to the lower prices and flat range, you can see the attempt to push VXX lower at the EOD as it peaks below the range, but the accumulation is what we want to see and it's telling us that they are seeking protection.
The actual VIX futures also show the same positive divegrence/accumulation so we are seeing exactly what we'd like to and we may have a position in VXX or UVXY VERY soon.
This is VIX futures (candlesticks) vs ES (SPX futures purple) today, you can see how the inverse correlation works, this is why I invert the SPX's price so you can see the rue relative performance.
HYG (HY Corp. Credit) is the last asset, it need to be up, I mentioned they managed to hold it together Monday, but
there was distribution already so that's not surprising and I don't know how much longer HYG can hold.
This is the 15 min chart of HYG, a huge leading negative divegrence and longer term it's in worse shape.
I'VE NEVER SEEN CREDIT SSO DISLOCATED TO THE DOWNSIDE FROM THE MARKET AND REMEMBER, "CREDIT LEADS, STOCKS FOLLOW".
THIS IS THE NEAR TERM 3 MIN HYG CHART, SO WE ARE SEEING NEAR TERM DISTRIBUTION, VERY STRONG TODAY SO I THINK HYG WILL LIKELY SEE DOWNSIDE SOON AND THAT WILL BE EVEN WORSE FOR THE MARKET THAN WHAT WE SAW MONDAY.
Speaking of High Yield Credit, I was surprised that the non-correlated, non-manipulative High Yield Credit held up yesterday, perhaps they new the bounce was coming Today (Tuesday), but today it had some trouble.
Yesterday it held in a range with the SPX falling, today as the SPX gained you'd think a risk asset like HY Credit would gain too, but it looks like they took the opportunity to sell to the greater fool as it made an especially strong move down in to the close.
Yields are a GREAT leading indicator and they act like a magnet for equities until they revert to the mean.
Here we have yields reverted to the mean at the green arrows, then Monday Yields were low and pulling the market down toward them until they reverted to the mean at the lows as you can see. Today as the SPX gained, Yields didn't follow and are negatively displaced, putting downside pressure on the market.
This is FXY vs the SPX, except the SPX price (green) is inverted again, this is the key asset (you can use FXY if you don't have currency charts), yesterday the Yen was leading and the market dropped (remember the SPX is inverted here), today the Yen dropped as the manipulation started yesterday around 3 and the BOJ came in to the picture and as you can see, a drop in the Yen sends the carry trades higher and the SPX higher with them, but the Yen is the number 1 asset to follow as it represents the carry trades.
Now for some FX...
This is the Yen right now tonight on a 1 min chart, not a great overnight timeframe, but there is clear accumulation suggesting the BOJ is losing control and the carry trades are being closed again as the Yen is at more favorable prices tonight.
The 5 min chart that I said held up way better than I'd expect today is also seeing a positive divegrence, this is a more important chart and I want to see what it looks like tomorrow.
Remember I was concerned with the divergences I saw in the $USDX, here's one and it sent the Index higher (green arrow), but as I hoped to see, it didn't help the USD/JPY much if at all.
This is a 5 min chart of the EUR/JPY carry, note the positive divergence at yesterday's lows and note the negative divegrence at the current highs.
We see the exact same in the USD/JPY carry cross.
This is what the EUR/JPY 1 min chart looks like tonight, not exactly like the straight uptrend earlier. Remember I showed how the price trend went from normal at the green arrow, then got parabolic and unstable at the yellow arrow and then lateral at the orange arrow? Well this is the result that those arrows and the Rate of Change in price were predicting, that's why I posted those charts.
As for the effect on the Index futures as that's what really matters, although they Yen drives the Carry crosses and the carry crosses drive the Index futures....
5 min charts are what matter, especially overnight.
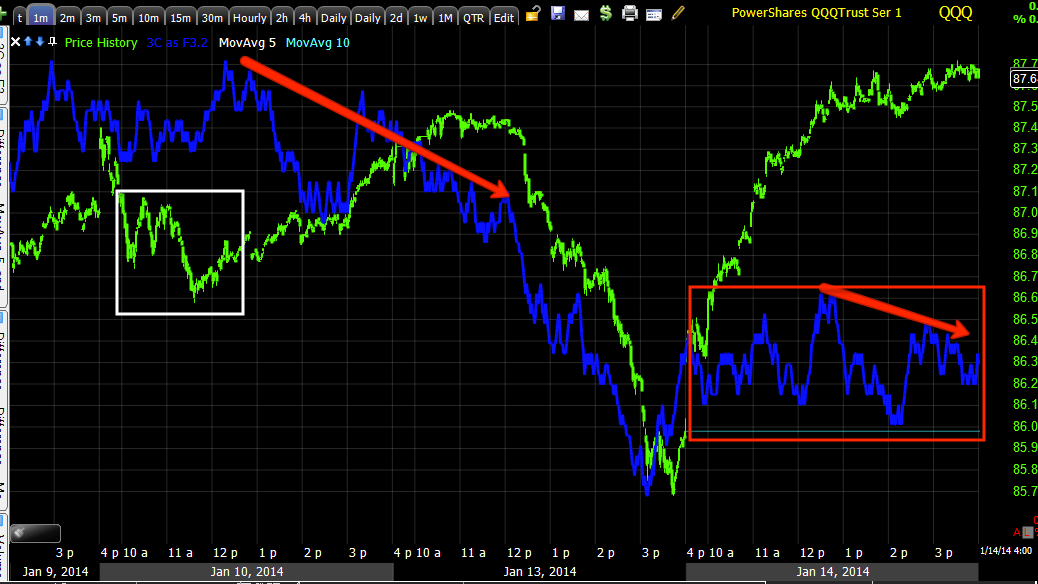
Early today I said the 5 min charts have enough room to let the market move up, that's the area in the white box, not a true positive divegrence, but room.
Now we have a leading negative divegrence coming in to play for the Russell 2000 futures.
Es is the same, you can see Monday's negative divegrence and fall and the room allowing for upside at the white box and now SPX futures are seeing a negative divegrence forming, it's still young, but this is what we want to see in to price highs and a flatter price range.
This is R2K 4 Hour futures, the big picture, I'm sure you can see what the chart is depicting, just understand how strong the signals are on this chart.
4 hour SPX futures...
4 Hour NASDAQ 100 Futures, all leading negative and in the worst position recently.
Remember the CONTEXT model for ES and it being about 8 points positive and I said, "This will be in the red soon"?
Now we are 9 points negative and in the red, most likely it's the carry trades and HY credit dragging the model down.
I wanted to mention this since it's making it's way around, the Baltic Drys Index (shipping rates for dry goods) are seeing the worst start to the year in ALMOST 30 YEARS!!! They are down 40% since the start of 2014!!!
Wait until Q4 GDP comes out, ooohh!
This is large, but it's still parabolic as the market is fractal so as you can see, we are seeing prices collapse as global trade collapses.
Finally, the Nikkei 225 Futures...
5 min short term positive and confirmation, now going negative, they look like most of the market and averages today.
The larger trend shows an in line downtrend and what I'd call a counter trend bounce, but even here it's starting to go negative so look for a reversal soon to the downside. The big picture...
The 4 hour NKD futures, look a lot like the SPX, NDX and R2K futures don't they?
I'd look for some volatility early tomorrow and the charts (3C) to get even worse, MCP may be a long add to, USO long may work, maybe some gold trades and VXX, maybe even some index trades.
However, I would still expect some choppy volatility, not a nice smooth transition, Wall St. won't make it that easy, but as long as we have a clear picture of underlying action as we are getting, it doesn't matter, in fact it can be useful.
I'll see you in a few hours.


No comments:
Post a Comment