Transports were mentioned as a trade set up Tuesday 12/2 in
Transports Trade Set-Up / IYT. In that post I included these charts (which you can check out in more depth by clicking the link to the post above).
First from the post above is a chart of my Trend Channel and the trend from the October lows having been stopped out which often produces additional short term lateral chop/volatility, but 90% of the time, the trend is done and there's no reason to stay long once the channel stops you out.
The trend line at #1 was from a former post as an example of a
3C concept, "Where the 3C divergence is first seen, price will surpass that area) which it obviously did by quite an amount, but this also gives you some insight as to what the accumulation process for institutional money looks like and why most reversals are a process like this rather than a "V" shaped event-just look at a bunch of charts and you'll see very few "V" shaped reversals.
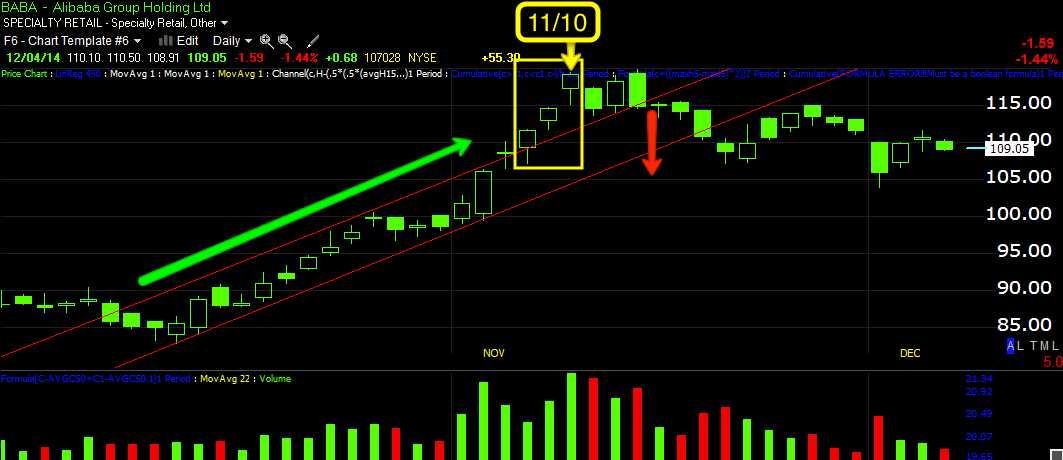
I also mentioned the "Channel Buster" concept which we've recently seen in BABA and in which we predicted on 11/10, a day BABA was showing incredible price strength with a +4.59% gain, that it was in fact a red flag and the highest probability was a sharp pullback under the channel, forecasted 7 days in advance.
BABA Channel Buster Example...
BABA had a very clear, very strong trend and the 3-days in yellow "appeared" to be a strengthening of the trend, but in actuality as one of our multiple timeframe / various asset concepts,
it is actually a red flag telling us the trend is about to change and in this case the most probable pullback for BABA (the first in this trend),
would be BELOW the channel- an -11% pullback.
This is a strong concept that was able o forecast the pullback area 7-days in advance on a day when BABA was up nearly 5% and looked stronger than ever. 3C confirmed, but the concept would have held even without the use of 3C.
The same is true of Transports on the chart above which I'll produce again...
Note the upside ROC and change in character taking BABA ABOVE the channel
, it's most probable outcome is a move below the channel. At the red arrow we had a price and volume distribution day on a very bearish candlestick, which was the high for transports.
In the same update from Tuesday linked above I also included these longer term charts...
2 hour going from trend confirmation (green arrow) to an upside ROC and in to distribution, with the sharpest divegrence at the current October rally.
The 60 min chart shows several divergences including the October lows being accumulated and distribution in to the move higher.
And the 15 min chart shows the distribution of the "Distribution Day" and then the chart in line
which is why it wasn't a trade, but a trade set up.
At the end of the post I said I was setting price alerts and looking for a move higher,
"This 1 min chart doesn't show any negative activity intraday so I suspect a bounce in trannies is coming. I'm setting price alerts from $164 to the $168 area and will be looking for an excellent high probability, low risk entry as the trade either comes to us or we move on to something else."
Today IYT was right in the range I set alerts for.
In last night's, Daily Wrap I posted the chart below with the following commentary...
"looking at the daily closing chart of Transports above, considering how clean the "Shooting Star" reversal candle (yellow box) was and the following confirmation candle, it almost seems highly probable that the Dow-20 could put in a "Falling 3 Methods" consolidation/bearish continuation pattern. The only thing needed would be a real body (open to close) that remains within Friday's large bearish downside candle like the yellow one I drew in. This is a fairly common candlestick pattern, essentially a bear flag that ends as a bear flag should."
The yellow candlestick was drawn last night and would be what was required for a "Falling 3 Methods" bearish downside reversal pattern.
Today's close...
The exact candlestick close I was looking for last night for today, completing a "Falling 3 Methods" bearish set-up reversal pattern. *It's important to note that according to Candlestick theory, there can be more than 3 candles in the pattern preceding the large day down, as long as they all remain with their real bodies (open to close-not counting the high/low wicks) inside the real body of the large bearish candlestick that starts the pattern.
As for today's updated charts, since the longer term charts are still in effect and have not changed, it is the short-to intermediate charts I was watching for in order to enter a Transports/IYT short.
The 2 min Transports went negative last week in to the distribution day and again after Monday's flameout-1-day oversold selling climax and bounce, it has gone negative again hinting that the timing is right for IYT.
As I said in today's
Trade Idea: Transports (short) IYT, it is rare to see a clean downside reversal from this kind of bear flag, there's often some volatility, although when looking at it on a daily chart it will often appear to be a clean downside reversal so there may be some opportunity for those interested if that volatility develops. Otherwise, transports are at a very high range and an overall excellent entry area with much lower risk. While I don't favor chasing anything, I wouldn't be concerned about an entry a little lower than today's close and I'd welcome an entry a little higher if it is to be had on intraday volatility.
I'm looking for migration of the 2 min divegrence and see it clearly on the 3 min chart showing the divegrence has strengthened as it leads negative today like last Friday.
The 5 min chart confirms further migration and a stronger divgerence and...
The 10 min chart is clearly negative and leading.
And the 15 min chart is along the lines of the longer charts, leading negative since the start of the move in Mid-October where it was accumulated for this move.
The mid-October lows/accumulation are seen to the far left with the 15 min trend leading negative. The longer term charts are above from Tuesday's post.


No comments:
Post a Comment