Monday, April 29, 2013

Leading Indicators...

Some of these indications were captured as I first posted that the levers were being pulled to get the SPX above that resistance level and create a head fake move and some I went back and grabbed captures after they no longer needed to pull the levers, the break out is self-sustaining as retail buys it, until retail can't hold it anymore.

It will be interesting if we have the time to go back later and see at least how TLT, VXX and HYG acted.

*All Leading Indicators are compared to the SPX in green unless otherwise noted.

 High Yield Credit was not following the SPX on the breakout move-obviously this was captured after, but HY credit is not one of the 3 levers, the 3 levers are High Yield Corporate Credit (HYG), TLT (20+ Year Treasuries) and VXX (Short-term VIX Futures).

I'm not surprised HY credit didn't confirm and instead put in a negative divergence at the break out area or the head fake area I mentioned well over an hour ago.

This is HYG BEFORE the breakout move, it is keeping perfect pace with the SPX.

 Here's the slightly longer view where you can see HYG is higher than the SPX at roughly the same relative area (at the two highs seen above).

 This is an HYG capture after the breakout, HYG is no longer following the SPX, it fails to make a higher high; it is still negatively dislocated with the SPX, but not leading yet.

This is HYG intraday 3C seems to be keeping up, buy HYG is struggling, it's already at a negative divergence with Friday's trade.

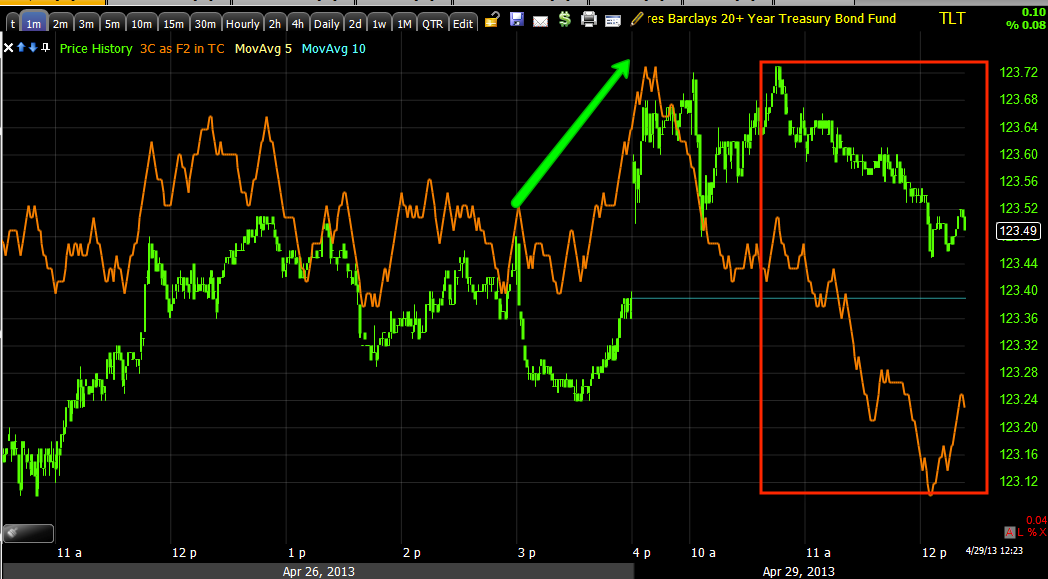
TLT seems to be the main lever and it is one of the 3, this was the first I saw negatively diverging BEFORE the breakout, this is when I posted the "Levers" post and showed you the SPY arbitrage improvement.

 Note how TLT gapped up this morning WITH 3C confirmation of the move, then saw a negative divergence on an intraday chart to push it lower, thereby effecting the SPY arbitrage value.

 You can see the same in Yields, they were moving negative and around the same time as the other levers were pulled, Yields started rising, helping the market BEFORE the breakout. Yields ARE NOT confirming the SPX move, although I wouldn't expect them to.

 VXX is one that is holding up better than it should be, it's the same phenomena we saw just before the last 2.3% 1-day correction in the SPX, it was seen in TLT also and we saw the same late last week.

VXX is seeing a positive divergence as you might expect in to lower prices here after the SPX move.

 The $AUD is broadly supportive of the market as can be seen between the two relative price (SPX) highs.

Intraday though it goes flat at the SPX breakout and has not been supportive since then, actually declining since.

 Euro is also broadly supportive, this is one reason I think the pullback/consolidation will be short lived to finish up the upside move, then these should all start negatively diverging with the SPX. The fact they hadn't is why I'm not so hot on playing a downside move.... yet

 The Euro intraday was supportive until the breakout, now it is negatively diverging.

 The Yen became supportive as it moved down, although I doubt this is part of any manipulation.

I'm going to check currencies because as I said before, they were the asset class that was hung up earlier.


Just as I posted the last update...

Exactly what I said, I noticed it first in the NYSE TICK Index (1 min)...
 NYSE 1 min TICK shows an obvious move in the market, IO checked the SPY next...

Here's the intraday trendline I showed in the last post and there's the head fake move.

Levers Are Being Pulled

I'm working on the Leading Indicators post and as soon as I saw the first few indications, I immediately check the SPY arbitrage to see if it was improving as it looked like some levers were being pulled from the Leading Indicators layout, no surprise...

It's not quite positive, but it is 30 minutes delayed, but it is moving up and at this point, only a $.05 negative differential, as I suspected, this is why prices are sitting where they are with these negative divergences.

I still think it has something to do with this...

At least 80% of reversals pull a head fake move first and in this case, that's the SPY moving above $159.27, we already know it will be a head fake move from the depth of the leading negative divergences, but these failed breakouts create strong momentum for a reversal and the fact that they are now using levers tells me they haven't been able to make the $.12 cent move and need the extra help of short term intraday manipulation, most is coming from Treasuries-TLT.

AMZN Update

Before I get to AMZN, just check out the ES (SPX futures) intraday chart, it need no annotations from me.


I still have the AMZN May 13th $250 calls as an open position and still like it, regardless of market expectations. AMZN has went from a downtrend-quite sharp, to a lateral trend, as you know I often say, "Reversals are a process, not an event"; this is largely because of the size of institutional positions and the time it takes for them to get a position together as they can't do it all in one order like we can becausew of the size. That being said, for a parabolic move down, even the movement today is about in line with what I'd expect from a reversal process.

Here are the updated charts...

 The intraday 2 min AMZN positive divergence...

The 3 min is seeing migration from the 2 min  so that's good and we have a leading positive divergence (the strongest kind).

The 10 min, as mentioned Friday, never confirmed the price low, it had more than enough time to do so and still won't. Also the rounding here is proportionate to even a dead cat bounce reversal space.

The 30 min chart isn't saying AMZN is a screaming buy, in fact you know I want to short it in to strength, but the recent drop is not confirmed here either, instead we have a relative positive divergence.

Even momentum is turning positive, the momentum indicator, RSI (setting6/1) , MACD (setting26/52/9) and Stochastics (setting 50/3)

Market Update

Although I think (as mentioned before), this is a tradable area to the downside, I'd prefer to wait for a stronger setup; that may be a quick bottom and upside move to finish this upside move we expected and got. However that is just a means to another end in getting set up on the short side in to price strength, as I showed last night and last week, the negative divergences are building faster than I would have thought so I don't think we are too far from that which is the real goal here.

As for intraday charts, they have gone more negative, CONTEXT for ES and SPY Arbitrage both look interesting, there are some currencies that seem a little hung up/stuck right now so after this I'm going to check the futures there as well as the Leading Indicators layout.

In any case, here are the intraday divergences for the averages, remember these started going negative last week so the intraday confirmation is more tactical than strategic (timing).
Speaking of timing, the head fake move is one of the best timing tools, for the SPX a move above $1592.64 would represent the head fake area, if I saw that coming and I were aggressive, the moment it crossed back below that level I'd be looking for intraday shorts, maybe a bit longer.

 ES intraday

NQ intraday

DIA intraday leading negative this morning like the futures above...

IWM 2 min deeply leading negative.

Same with the Q's

And the SPY

Another indication to watch for timing (although it has very little trend this morning which is telling in itself, is the NYSE intraday TICK, look for any change in character/trend as it usually is found there just before price moves.

Quick Update

Now that a.m. trade has burned off, we are getting ready to come down intraday, futures as well as the averages have gone deeply leading negative.

I'll be updating with charts next.

AAPL $390 Call P/L & AAPL Update


The AAPL May 3rd $390 calls expiring this week, I don't want to sit around when a pullback occurs, even if AAPL ends the week higher, the time decay on these calls is just too big a liability. This morning's momentum offered a nice exit just under 1.9% and thus far, a VERY timely one as upside momentum faded just as soon as we got a small lift from the swing down when I posted I was closing the position; it turns out waiting an extra minute or two allowed us to close in to upside momentum.


 At the fill above of $34.50, the AAPL calls made nearly +33%

As for AAPL near term and a bit longer term...

This intraday 1 min, along with the general market analysis was enough to convince me that the time decay at this point, with this gain in place on the day was going to be the main factor in influencing price and not for the better.

 A longer view of the trend of the same 1 min chart also confirms this as the highest near term probability.

Here's the 2 min chart's trend since accumulation and the move up

Here's the 2 min chart intraday with a relative negative divergence so the negative divergence was getting stronger as it migrated through longer timeframes, still this is short term action, but long enough to damage the profits in the calls.

AAPL 10 min looks like it could see a decent pullback at this level

The 15 min chart tells me (as of now), that AAPL has more gas in the tank, after a pullback, we should be able to ride AAPL higher, but I don't see a high probability set-up / timing for an entry for a put play, I'd prefer to wait for a pullback and look for accumulation in the pullback telling us AAPL is getting ready to make a run for a new high for this leg as the correction ends.

As for why, other than the overall market tone, AAPL is at a serious resistance area as well as resistance provided by a gap (yellow), this seems like the perfect area for AAPL to run in to congestion and move toward a pullback before it likely continues higher to a new high for this leg up, we'll likely be in on that trade so long as the probabilities look high and the risk low with good timing signals.


Closing AAPL May 3rd $390 Call, hopefully in to 1 more swing upward

Pre-Market Futures

It looks like we were right to hold still on Friday and await Monday for better opportunities and it looks like we were right on the near term (today) direction of the market, despite the pre-market futures, we have EXCELLENT signals confirming our expectations for today.

The Index Futures...
 ES (SPX Futures) ran higher at 2 a.m., the same time the EUR/USD did, to the left is the Friday 4 p.m. closing level, we're not too far above that, but we have a nice negative divergence going in to regular hours trade.

NQ (NASDAQ 100 futures) showed an earlier positive divergence last night, we have in line trade at the green arrow and a negative divergence in to the open of regular hours as expected.

TF (Russell 2000 futures) saw a positive divergence at midnight and in premarket have a huge leading negative divergence.

Currency Futures...
 The EUR/USD headed north at 2 a.m. this morning, however the negative divergence started last night is 4 times as large going in to regular hours, the implications are not good for the market and therefore confirm our Index signals above, at least short term (where we may find some nice opportunities).

 Even the EUR/USD 5 min chart is in a negative divergence-green arrow represents the open of FX trade for the new week .

The single currency Euro futures have an enormous leading negative divergence, it's little wonder the EUR/USD looks so bad. I think FXE short might even be a trade worth looking in to if you can day trade.

 EUR/JPY carry pair saw no positive divergence last night, they just followed the Euro and Yen, here we also have a huge leading negative pre-market divergence (again not good for the market).

And as seen last night, the $USDX ($US Dollar Index futures) have an enormous leading positive divergence, confirming the EUR/USD signals and being bad for all risk assets, the market included-EVERY chart confirms each other.

As for Gold and Silver, interesting too and just as we expected late last week when we took our 1-day 93% and 95% profits in GLD and SLV calls...MORE OPPORTUNITY at the right time!

 GOLD futures 1 min with a leading negative divergence in to the open

Even more ominous, gold's 5 min chart with a deep leading negative divergence as seen last week.

Silver futures have the same leading negative divergence. I think any of these can be played intraday, but we are really looking for the set up as 3C tells us when we have arrived at a bottom (which may be today) for short term option trades or leveraged ETFs.