Thursday, August 15, 2013

GOOG & Update

We needed more time for the market to build anything that would hold any kind of move and now in most averages except the IWM, we have a wider "W" bottom which looks better, I'm not sure I'm sold on it, but one stock that looked pretty interesting for a long bounce using calls is GOOG.

 GOOG 2 min

5 min

10 min

And it already has done some work as the 30 min chart shows.

I'm still not sure I want to take the chance until things look really steady, but this is one I'd certainly be considering.

UNG Update

Last week UNG started coming around, I still like UNG as a longer term position, I do NOT view UNG as a trading position although we have traded in an out of it several times to avoid drops like the last one, I believe we moved out of the UNG long in 2 parts around mid and late April.

Recently UNG started looking good again as a longer term long position, here are the charts today, there's some loose intraday short term charts, but the recent bottom looks solid and there's nothing that would pull me out of UNG right now (as I said, I don't think it's a great trading position.

 Our DeMark-Inspired "Buy/Sell" indicator with a recent buy signal at the bottom.

 Intraday charts are largely in line, there are a few that are a little sloppy, but I don't think they'll start a trend.

The 5 min chart with a question market because the current 3C reading "would " be a slight negative if 3C had turned down and locked in a pivot which it hasn't yet. Even with that, the accumulation phase is much larger.

The 10 min from in line to leading positive

The 15 min leading positive as well

The 30 min leading positive

And the area of distribution where we got out in a phased exit, the first day was at the highs. Then an in line reading and a recent positive reading.

All in all I like UNG here, I like to have a little long exposure and this seems like a nice long term position to get that in.

Leading Indicators...

Last night in the "Daily Wrap: NOT THE SUMMER DOLDRUMS" which was a continuation of Tuesday's "Daily Wrap: The Summer Doldrums?" the first two paragraphs read like this...

"Last night's "Daily Wrap" somewhat rhetorically asked if we were in the "Summer Doldrums" a period of very dull trade during the summer, but I haven't seen it in years. The Doldrums literally feel like you're on a sailing ship at sea in the hot, humid summer sun with ZERO wind, just sitting there...waiting for something to happen.

However as I said last night, "... the market looks like it's in true summer doldrums, but I'm not sure I believe that is what we are seeing.... I suspect it's something a bit more serious."

One of the concepts that is true in so many scenarios is that of, "Changes in character lead to changes in trend"."

Obviously the changes in character were not the Summer Doldrums as so many have speculated the last week.

This still leaves us with the possibility/probabilities of a bounce (which as explained last night becomes more and more unpredictable the further we get in to the big picture because just like AAPL's 300+ point/ -45% decline, at some point someone in the hedge fund herd decides "He who sells first, sells best" and like AAPL, we have a stampede of panic with everyone trying to fit out the same small door". However making things worse this time is the amount of leverage in the market and we haven't truly seen what a market decline looks like with the dominance of HFTs providing market liquidity as they are not obligated by law to do so like market makers and specialists. In rallies HFTs provide a very narrow bid/ask spread, but in a decline, they can shut off liquidity in an instant, making that much harder for longs to sell their positions and as I have said, "Who are they going to sell to? Smart money has been selling to them all year, they aren't taking the shares back up here and volume has dropped off  to what is only a level in which I think it will be looked back on as one of the main culprits of a decline. LIQUIDITY AND VOLUME ARE NOT THE SAME THING. Sure, market makers and Specialist have to make a market even in a decline and take the other side of the trade if it's at market and there's no willing participant to take the other side, but this doesn't mean they have to offer anything approaching a reasonable spread.

In any case, along with the F_E_D's 45 page report released this week about how leveraged ETFs and their re-balancing in a decline are likely to exacerbate it to unknown, but terrible proportions, this is just something else to consider.

Until we get to that bridge though, which I'm happy to see our core shorts performing at approx. a beta of 9 (9% gain today) I know that's not the correct term, but I think you understand, for now it's about where we are going and how we want to play it. As I said yesterday during market hours, "Until we have solid confirmation, I'm on the sideline"

So lets look at Leading Indicators to see if there's any clue and then again at the close.

 The SPY Arbitrage is moving to the positive side, now near +$.40 SPY, this is sort of significant because as you might recall from our analysis of the carry crosses, the opinion was the following...

"as for an engine, it's hard to imagine a carry cross doing the work, especially the $USD/JPY, maybe the AUD/JPY, but as you'll see, the JPY has some 3C strength that would make any carry cross driver difficult."

The fact that the AUD didn't look like it could overcome strength in the JPY as of last night and the $USD looked even worse, the carry crosses like USD/JPY that had been carrying the market until two days ago when the AUD/JPY took over, all looked like they'd be shut out due to Carry trades being closed as was evident in JPY performance and 3C charts, that leaves one other probable mechanism which is the SPY Arbitrage (maybe AAPL for the Q's) and we see the SPY Arb. moving up.


HYG, one of 3 parts of the Arb is outperforming today which is likely part of the reason the Arb is positive.


And TLT is weak today so that's helpful to the SPY arbitrage.

 (VIX intraday vs an inverted SPX) As shown earlier, even though VXX is higher on the day, its 3C charts look like near term weakness is most likely so if VXX falls that improves the SPY Arbitrage.


 Junk Credit tends to trade very similar to HYG, the leading in JNK vs the SPX today is interesting, I'd like to see it at the close.

Yields are like a magnet, the scaling here isn't great because Yields were leading on the move up on the 13th so they'd be even higher now, considering they have a magnetic-like pull on the SPX, their positioning looks bullish for the VERY short term market.

 Commodities have also made quite a turn-around with excellent relative performance today, largely due to PMs.

A little $USD weakness has also helped intraday.

I'd say this is far from definitive, but the short term character is starting to take on more and more confirmation since the first charts this morning of 1 min positives only.

Market Update -

Just a few minutes ago in an update I said I think for the market to get a toehold and launch anything along the lines of a bounce, it's going to need more time around the gap lows today, we are getting short term 1 min signals that this is what is happening and likely going to lead to the expected outcome or at least the one data is leaning toward.

 DIA 1 m

QQQ 1 m

SPY 1 m

This pullback would give the market the time it needs to do some damage repair, so long as the charts keep migrating, 2 min positive to 3 min positive to 5 min positive, EVEN with prices at lows of the day, the probabilities of that bounce grow stronger and stronger, that is where some plausible trades are to be found.

VIX, VXX, VIX Futures

I have been posting accumulation in VIX Futures for at least a week on the 60 min chart, the last few nights I've shown it getting closer intraday which makes a move more likely like last night's VIX Futures charts in the "Daily Wrap" which showed the 60 min chart joined by the 15 min and 5 min suggesting some move was imminent, but even before that, in this post yesterday VIX Futures Seeing Some Changes I showed what was a significant change in short term character as long term charts are already showing significant accumulation, this is one of the few sets of charts that REALLY stood out yesterday, I'd encourage you to look at the post just so you can see the change in character as "Changes in character leads to changes in trends".

This is today's update for intraday VXX, UVXY, XIV, and VIX Futures, there's a significant difference in today's charts vs. yesterday's, I fear that this was the trade that was screaming as far as short term goes.

The changes today may indeed be a sign of further changes to come as VIX trades opposite the market so if the market averages keep moving as they have been this morning and the VXX / VIX futures see more deterioration, all of the sudden we have a much stronger case for the market bounce.

AGAIN, for comparison, this is yesterday's charts of VIX related assets, the change in character yesterday was extreme and it gives a reference point for where these assets are today. I strongly encourage you to at least take a quick look at the charts from yesterday.


 VXX 1 min shows part of yesterday's strength although without today's action you can see much more clearly what a change in character VIX futures underwent.

The 2 min chart today is not staying in line, it's turning toward a negative divergence which confirms the market averages 2 min charts turning toward positive divergences.

 VXX 3 min is in line, but so are most market averages so thus far they tend to confirm and suggest the short term is still on for a bounce, we are very early in the confirmation process, we couldn't get it yesterday and you saw what happened today so I'm inclined to wait for solid evidence.

 UVXY's 1 min is showing a clear negative on today's pop higher.

XIV 2 min which trades opposite VXX and UVXY and WITH the market averages is showing 2 min positives much like market averages lending more confirmation and credibility to those positive charts that are in place now.

 This is one of the VIX futures charts posted in last night's "Daily Wrap", it's a 5 min. We already had and will continue to have the long term 60 min chart positive, the 15 min chart was also positive in last night's post and I believe the night before, yesterday was special not only because of the intraday VXX signals, but because the short term 5 min VIX futures went positive, we can clearly see the result of that action yesterday.

This is the intraday 1 min chart of VIX Futures showing short term distribution so this also confirms short term positive divergences on the market averages.

Market Update- Transition

We are seeing some transition in the market, it's still not enough to cause me to consider any new positions for short term trades, the main difference now is that the SPY is coming around and the 2 min charts are adding to the intraday positives.

 Even the SPY 1 min wasn't positive like this earlier so this is gaining some ground.

Now the 2 min chart is RECENTLY leading, almost all of the averages look the same, to me it looks like the right side of an inverse H&S is seeing increased short term accumulation, I still don't know that I'd risk anything here yet.

Some other developments include Index Futures, specifically ES (SPX futures) going positive on a 5 min chart whereas earlier the best we could get was 1 min charts, but it is ONLY in ES.

 ES 1 min

ES 5 min now positive adding some credibility to what's going on near the gap lows.

 NQ 1 min only is positive

The same with TF (Russell 2000).

As for developments in the other major averages:

As mentioned the 2 min charts are seeing a strong leading positive divergence so this may be the first decent signs of migration of the divergence through longer timeframes, it's evident in the Q's IWM and DIA.

Most timeframes after that in the 3-5 min timeframes are in line, some slightly better, some slightly worse, I think the only way the averages put in any short term bottom here that is stable enough to take a position on is if they get more time down in the range.

Gold Miners: GDX (NUGT / DUST)

This post does not include Junior Miners, GDXJ, I haven't done enough analysis to include those in with this group.

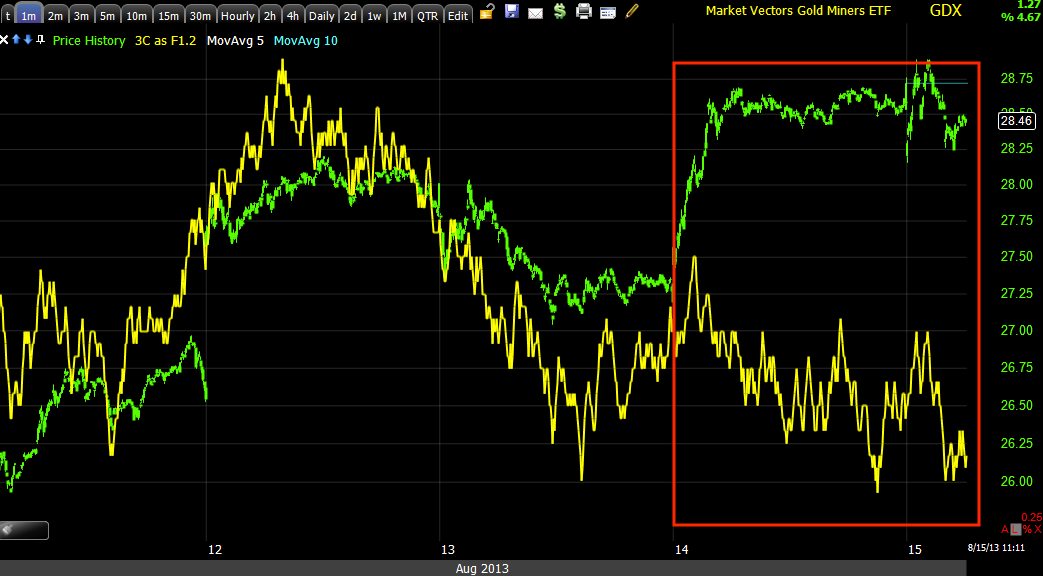
Yesterday I showed some charts of the gold miners and about an hour later I opened a speculative GDX Sept. $30 Put or DUST long

That position is just in the green right now, but considering the September expiration, as of now I see no reason to close it out yet.

 GDX 1 min (NUGT is like being long GDX using an ETF with 3x leverage, DUST is the opposite, short GDX with 3x leverage).

Obviously the near term charts were quite negative which is one reason I liked them yesterday.

This is the 2 min chart, also negative, but a case could be made for some intraday strength at the a.m. lows if you follow the bottom side of 3C higher in to the price lows.

The 5 min chart appears to show the GDX cycle from accumulation to mark up to distribution (next is decline) pretty clearly, also something I like about the Put position or long DUST.

The 10 min chart shows the same cycle, it has less noise and more trend and the underlying trade is clearly leading negative at not only a flat range, but what could very well be considered a head fake "False breakout".

The 15 min GDX chart also shows the cycle and the end of the previous cycle to the left (distribution and decline).

There are longer charts I could use in this analysis, but the fact is this was set up for a shorter term position and I think we have enough here to make GDX Puts (DUST long or NUGT short if your broker will allow it) in place for now.

Market Update

First lets get a grip on where the broad market is and then we'll look at individual assets as the broad market accounts for about 2/3rds of any given stock's direction on any given day.

I talked about this subject last night, but more specifically Tuesday ,

The second paragraph of the Daily Wrap was as follows,

"If I had to make a call on a bounce again this week or tonight based on a lot of charts, I'd say it would be very difficult to see any real strong market upside at all, there's very few areas that even have some of the short term enthusiams that has lifted the markets in afternoon trade. Index Futures look especially weak, as a matter of fact the only place I can find any buying excitement in underlying trade is VIX futures and that's not good for the market."

Here are the charts, right now they are VERY superficial, as I was saying yesterday, we need to see all of the averages come together as the QQQ was notably weak yesterday and we need to see more timeframes come together for a bounce, we're still in that situation as of now, except worse obviously.
Some of the charts that were in place and suggested a bounce from last week are simply decimated.

One thing I'll say that I'm happy to see, our core short positions in our equity only tracking portfolios have shot up 9% on the day and put us at a ranking of #50 of 1421 portfolios so we are obviously in the right places.


 DIA 1 min and this is about the only place there's any strength in 3C so I'd be hesitant to play it unless other timeframes came together.

DIA 3 min is about as close to in line as it gets.

However as I have been warning about trying to "Pick up nickels and dimes in front of a steam roller", just on the other side of those intraday charts are the ones that count like this 15 min and they just get worse as they grow more important.

THIS IS THE BIG PICTURE, THIS IS WHY I SAID, "WE ARE IN THE BIG PICTURE NOW, IT'S NOT OFF IN THE FUTURE".

 IWM 1 min is leading positive, it almost looks like a small inverse H&S in most of the averages, to get anything really worth taking a chance on here as short term trades go, I think we need to see at least 2-3 min charts go positive as well.

IWM 5 min is now in line

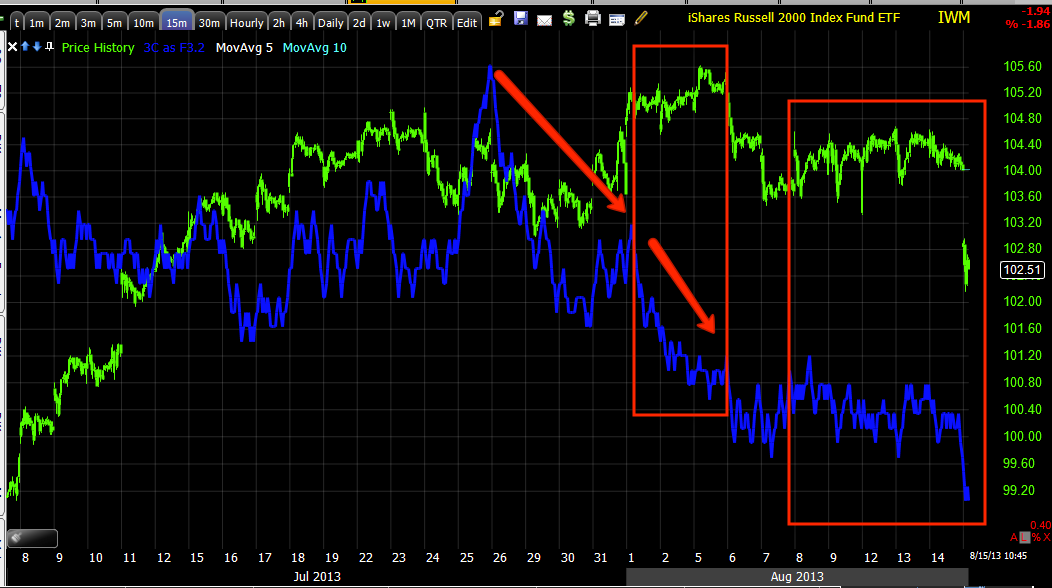
The IWM 10 min is where the bounce signal has been and so far it's still intact, but there's no telling whether the shorter charts deteriorate more or if they can build something to get a toe-hold, either way, it won't last long.

IWM 15 min is just on the other side of that 10 min chart and as you can see, there's a VERY clear difference between a short term bounce signal and a longer term "Big picture" signal.

QQQ 3 min (1-3 are all negative) was weak yesterday, this was one of the main points I was making, Q's and Tech were much weaker than price action looked which sounds counter-intuitive, but ever since last week they have been using afternoon recoveries to sell in to as we have known for at least a week.

QQQ 15 min is in line, actually 3C is worse than it looks here so again,  we are not "Close to the big picture", WE ARE IN IT.

 ODDLY THE SPY SHOWS THE LEAST INTRADAY STRENGTH THUS FAR.

The 5 min chart suggesting a bounce in the SPY (and remember it has only been one timeframe in each of the averages suggesting a bounce, that's it and the reason why I said "I don't blame anyone for sitting it out").

And the SPY 30 min shows how close the damage has been all this time, you may have seen the 4 hour last night that one member said, "Took his breath away" when he saw it, prompting me to post it last night for perspective.

I'll try to big down in to some individual names and sectors as well as keep an eye on how things are progressing.

All of the Index futures have 1 min positives like many of the averages.

Finally Back

Obviously my Doctor was running more than a little late today.

In any case, the overnight session gave up at least 7 points after an initial bounce higher, the destruction this morning seems to be from 3 economic reports that are all better or good news which is bad news for a Sept. Taper.

My initial look which I took as soon as I got in the door shows the Q's, IWM and DIA all putting in positive intraday divergences so I think they are pretty close to an intraday low and should bounce shortly. I'll get charts of those up next so you can see as they appear to be fairly imminent.

Wednesday, August 14, 2013

SPY 4 Hour

I'm kind of use to seeing these charts and worse, but a member mentioned he saw this and was shocked at how bad this chart is, I say, "This is the tip of the iceberg", but since I am maybe out of touch from having seen this so often and don't realize how much it might mean to you or give you a better understanding of what kind of trouble this market is in (far beyond the media's -20% correction), here's the SPY 4 Hour chart.
That is a leading negative divergence, it is making a new leading negative low, most of the damage here was done in less than a month, I suspect it has a lot to do with the need to wrap up "Carry Positions".