Friday, April 20, 2012

Risk Assets Update

 Commodities intraday are closer to the EUR/USD correlation than stocks are at this point.

 Long term, here's the negative divergence in the SPX top area as Commodities severely underperform equities, this is not viewed as a healthy risk on move.

 HY Credit is roughly moving wit the market today.

 Longer term, it refused to make any higher highs since early February. More trouble for the market.

 Yields intraday have diverged negatively, it looks like equities are moving with Yields a bit here, although I wouldn't think they would be so influential today. In either case, the intraday divergence is not good news for the market.

 The longer term divergences is very big, equities tend to gravitate toward yields.

 Here's that EURO break out in white from the last post, the market has diverged from the EUR correlation, although at the moment it is offering the market some head space above.

 Longer term, the correlation has fallen apart totally as the Euro makes lower highs, refusing to follow the SPX.

 This is a curious chart, although intraday and it could change quickly, Corp. Credit seems supportive here of some further gains intraday in the SPX.

Longer term, the trend in credit is clear, lower highs/lower lows as the market drifts laterally in very volatile fashion, exactly like a top would behave.

The intraday sector rotation is falling apart in most cases, defensive sectors are showing better relative momentum, Financials and Tech are falling off .
Industrials and Basic Materials are the only two risk on groups still holding up, Financials, Tech, Discretionary, Energy are all falling off while defensive sectors are rotating in, Healthcare, Utilities and Staples.

IT seems the internal intraday structure of the market looks pretty poor, but this is what we expected and why I'm looking to short strength.

European Close

 The European Top 100 closed up .68%, still below the now downward sloping 50 day average, but still above the downward sloping 200 day average. When I use to teach and particularly on the subject of trend classification and Dow Theory, I found a good proxy for trend classification was the slope of the 50/200 DMAs. The 50 dma representing the intermediate trend and the 200 representing the primary trend, so while the European top-100 still has probable support at the 200 which it will likely bounce off of short term, both the intermediate and Primary trends now seem to be firmly in the bearish camp, you might even say a bear market.

 Here's the breakout of the Euro I was counting on last night from an ascending triangle.

And a close up view shows a smaller ascending triangle that has just seen a breakout. I do not expect the larger breakout to hold, so this breakout is of particular interest in whether it holds or not. If it does and moves higher, the US stocks will have some more upside breathing room, if it fails on a head fake move, they will start to feel headwinds from $USD strength.

I'll be looking at risk assets next.


IBM Update

As mentioned many times, I want to be selling in to strength, not chasing downside moves. There are enough stocks out there that if the one I'm looking at won't come to me, I'll simply move on to another. I've been cautious in building a longer term equity short position, trying to only pick up stocks that are moving in to strength and leaving my risk management wide enough to add, it's a good idea to leave the stops wide for another reason-market volatility.

 I was hoping IBM would move up yesterday, rather it created a hammer suggesting it has found some near term support with some gaps still open above.

 The higher gap seems like a stretch, but the lower gap maybe not such a stretch.

 IBM was one of many of the stocks I looked at last night with a positive divergence, leading me to believe we would open higher today, despite yesterday's seeming ugliness, this is another point about the market's insane volatility. The divergence still looks good today.

 The 2 min looks like a consolidation for the time being and IBM has done pretty much that today.

We have a bit of a leading divergence on the 15 min too with the last very negative divergence seen to the left, which sent IBM much lower.

I'll be setting price alerts for IBM in the gap areas and looking to possibly add IBM if we get the price strength it seems to want to exhibit and a negative divergence in to that price strength.

Going ahead with a 1/2 size short in BEAV

That position will be short stock, not options although I may consider them later.

AAPL Earnings 4/24 After hours

Well, this is interesting. AAPL reports Tuesday after hours. AAPL rarely misses, they did have that one miss 2 quarters ago, but AAPL is known for very conservative guidance so a beat is virtually guaranteed. I have a feeling there will be a knee jerk reaction, but I think the market will be picking this report apart and looking at everything, not just the earnings and revenues.

AAPL today, as I mentioned earlier seems like a move lower or in the area as it trades in $5 increments for options, is most likely. Short term it's not giving up much in the way of underlying action, it is the parabolic move this year and the long term charts that look very dangerous in AAPL.

 1 min nearly in line, slightly positive.

 2 min slightly positive relative divergence

 5 min slightly positive leading

Big picture, huge negative leading 60 min divergence. This makes AAPL very difficult tactically speaking, I think big picture, AAPL is done.

You know I don't trust parabolic moves, they always tend to fail spectacularly, check out AAPL on a 5 day chart.


As of now my plan is to try to get rid of that fat finger trade on some strength and enter AAPL short equities at about 1/3 of my normal size, I'll wait to see the reaction on Tuesday to add. An AAPL beat may pop the market to the upside short term, but if the market finds that AAPL is likely not going to do better, then AAPL's quick pop would be useful to add in to-that is if they beat.


Op-Ex Update

SInce last looking at the SPY options chain, there's very large open interest at $140 calls, almost 300k contracts, at $140 puts the interest is at 244k , it would seem a close in the $139 area may look more likely, of course all of this can change as contracts are closed today. I would still be looking to short strength.

Market Update

Pretty much as expected, strength appears to be under distribution. I would think this is a delicate balance between using the strength to sell in to, but also trying to keep the market moving in the direction of max pain on the options expiration pin. The TICK chart seems to exemplify that concept. At the same time, I imagine there is an "Every Person for themselves attitude towards selling in to strength with hedge funds". This is where I suspect the market is the most tricky. All I know is I wanted to see strength to sell short in to and I don't want to get too lost in the lines trying to micro manage the entries.

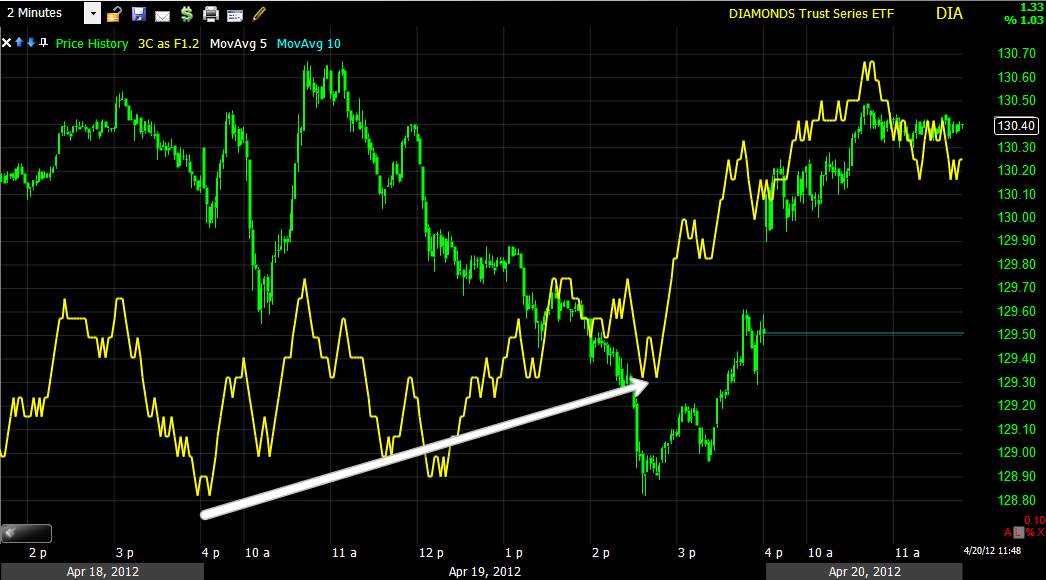
 Intraday DIA 1 min negative leading divergence-this is the selling in to strength.

 The 2 min positive from yesterday and a somewhat in line chart.

 The 5 min showing a small leading negative divergence. The market can rise in to this divergence as this is a reflection of underlying trade, selling in to strength, but I suspect they will still try to get better prices to sell in to if they can.

 DIA 15 min looks horrible as usual.

 The IWM 1 min with a deep leading negative divergence, remember I never thought the IWM was a real player in a head fake move as there are no really good, obvious levels to break above other than the 50 day average which is around $81.70.

 The 2 min IWM is seeing the 1 min negative divergence bleed over.

 Oddly the 15 min chart is nearly exactly in line with the IWM's price movement, not sure what to make of that.

 QQQ 1 min leading negative

 The 2 min was negative near the open, it seems to be picking up a little intraday positive divergence here. I'm not sure where max pain is on expiration for the Q's, but that may be coming in to play.

 QQQ 5 min is also showing a bit of a leading positive divergence, I need to take a look at AAPL again.

 QQQ 15 min is clearly negative every time the Q's have moved to price strength.

 SPY 1 min is slightly leading negative, this may be what i causing the consolidation laterally. It is usually after 12 pm where we see the dollar weaken, that has been a recent trend, so it may do so again and give the SPX some more upside breathing room.

 The 2 min is showing a leading negative divergence, again another reflection of selling in to strength, the same thing I want to be doing.

 The 5 min is still in line as the 2 min divergence isn't quite bad enough to bleed over yet.

 The 15 min is now in a leading negative divergence, as I said yesterday, any price strength will make these 15 min divergences look worse.

Here's the TICK chart, it is very uniform, no big spikes, no trends other than lateral, this appears to be the struggle to manage prices higher while still selling in to them without sending the market crashing lower.

Trading Volatility-UVXY

A long term member sent me this chart this morning of UVXY, an Ultra Long Vix SHORT TERM Futures Contract-Note SHORT TERM.

There are Fib. retracements on the chart as well as gaps in the blue areas.


With a market reversal and the VIX shooting up as Fear takes the place of complacency, Volatility in the VIX should rise. There has been a longer term positive divergence in the VIX daily chart...

 The last time the VIX shot up like a rocket was on the late July 2011 decline of nearly 20% in the market, VIX easily doubled.  Since there has been a bullish descending wedge in the VIX and as we see with nearly every wedge (I can't think of one that has broken out as Technical Analysis has taught for 50+ years) a consolidation (base) form.

 A closer look at the apex of the wedge shows a head fake breakout, after all, this is what wedges are "Supposed" to do, break out at the apex, followed by a failure of the breakout (now typical behavior for wedges) followed by a basing area that recently approached resistance a the SPX broke below the 50 day ma on April 10th, since then, the VIX has pulled back in a bullish looking flag consolidation.

The daily positive divergence in the VIX has grown over the last month.

As for UVXY, timing is everything in playing leveraged volatility ETFs, I have been burnt more than once, still for a well timed trade, this could put in some very serious upside. Any trade in such an instrument I would consider to be speculative and my risk management would reflect that.


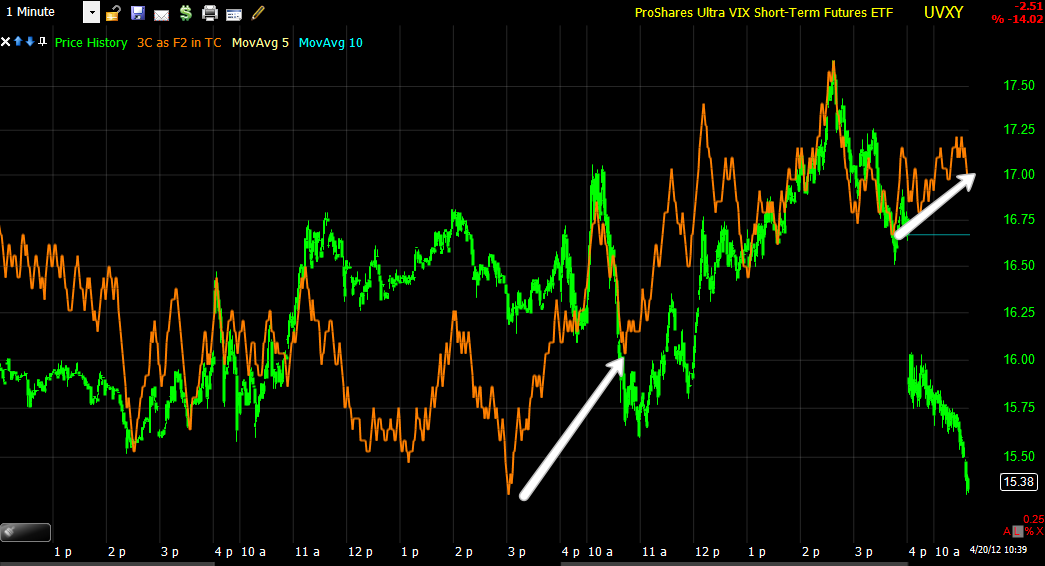
 There is the start of a positive divergence on today's big decline as the market is up and volatility indices are down, however this is just the start of that divergence, it has not made it to longer charts yet.

 You can see here the inverse relationship between the SPX (red) and the VIX.

 As mentioned, the 2 min UVXY is not seeing the positive divergence develop here yet.

However longer term it does appear that someone may be putting together a long position in to price weakness as the 15 min chart does have a leading positive divergence. I personally would wait for a very clear signal the market is starting to reverse and make sure the positive divergences in the short term charts are there.


BEAV Short Trade Idea Follow Up

BEAV was presented as a short trade idea April 18th, there was a triangle sitting right under resistance of a top formation that had broken, the idea was that instead of the continuation triangle breaking to the downside, Wall Street would head fake traders and brea BEAV out to the upside, allowing us to short BEAV in to price strength. This was one of the many stocks I mentioned last night with positive divergences, so far the plan is working.

 BEAV's top and the triangle below which traders consider a continuation consolidation, expecting it to break to the downside, as usual, Wall Street uses Technical Analysis against traders. There were two potential target areas to look at shorting BEAV, although you could probably start phasing in to a position here on early strength-up 1.54% thus far.

 We almost always see a head fake move (even within a head fake move), before the move actually starts.

 The 1 min positive divergence.

 2 min positive divergence

5 min positive divergence.

Right now it's too early to get  trailing stop on BEAV, but a nearly 1.5% gain for the day is not a small move. I'd prefer to see the short term charts start to go negative before entering, but again, it is worth considering phasing in to the position.