A long term member sent me this chart this morning of UVXY, an Ultra Long Vix SHORT TERM Futures Contract-Note SHORT TERM.
There are Fib. retracements on the chart as well as gaps in the blue areas.
With a market reversal and the VIX shooting up as Fear takes the place of complacency, Volatility in the VIX should rise. There has been a longer term positive divergence in the VIX daily chart...
The last time the VIX shot up like a rocket was on the late July 2011 decline of nearly 20% in the market, VIX easily doubled. Since there has been a bullish descending wedge in the VIX and as we see with nearly every wedge (I can't think of one that has broken out as Technical Analysis has taught for 50+ years) a consolidation (base) form.
A closer look at the apex of the wedge shows a head fake breakout, after all, this is what wedges are "Supposed" to do, break out at the apex, followed by a failure of the breakout (now typical behavior for wedges) followed by a basing area that recently approached resistance a the SPX broke below the 50 day ma on April 10th, since then, the VIX has pulled back in a bullish looking flag consolidation.
The daily positive divergence in the VIX has grown over the last month.
As for UVXY, timing is everything in playing leveraged volatility ETFs, I have been burnt more than once, still for a well timed trade, this could put in some very serious upside. Any trade in such an instrument I would consider to be speculative and my risk management would reflect that.
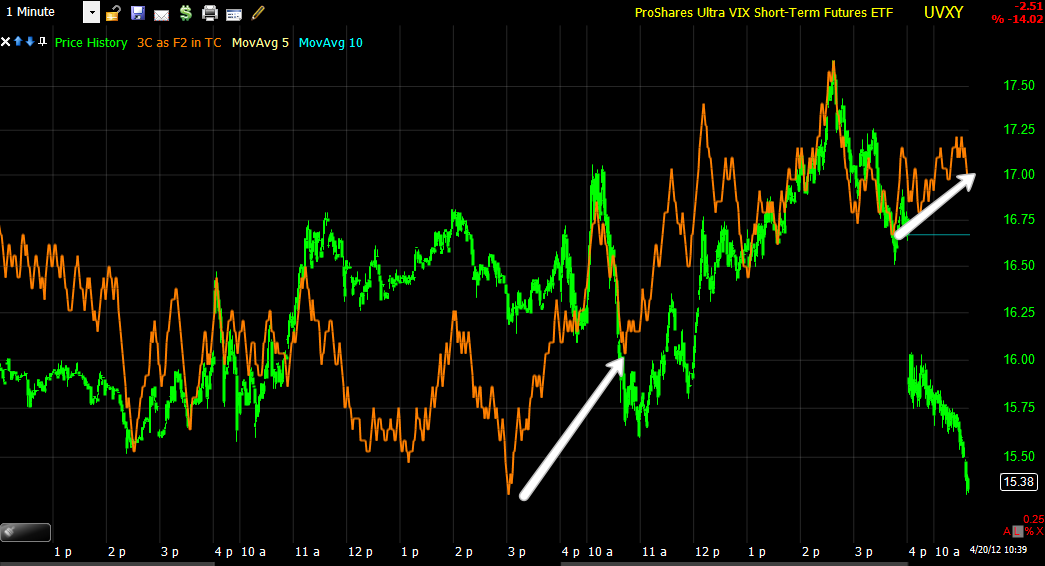
There is the start of a positive divergence on today's big decline as the market is up and volatility indices are down, however this is just the start of that divergence, it has not made it to longer charts yet.
You can see here the inverse relationship between the SPX (red) and the VIX.
As mentioned, the 2 min UVXY is not seeing the positive divergence develop here yet.
However longer term it does appear that someone may be putting together a long position in to price weakness as the 15 min chart does have a leading positive divergence. I personally would wait for a very clear signal the market is starting to reverse and make sure the positive divergences in the short term charts are there.


No comments:
Post a Comment