Pretty much as expected, strength appears to be under distribution. I would think this is a delicate balance between using the strength to sell in to, but also trying to keep the market moving in the direction of max pain on the options expiration pin. The TICK chart seems to exemplify that concept. At the same time, I imagine there is an "Every Person for themselves attitude towards selling in to strength with hedge funds". This is where I suspect the market is the most tricky. All I know is I wanted to see strength to sell short in to and I don't want to get too lost in the lines trying to micro manage the entries.
Intraday DIA 1 min negative leading divergence-this is the selling in to strength.
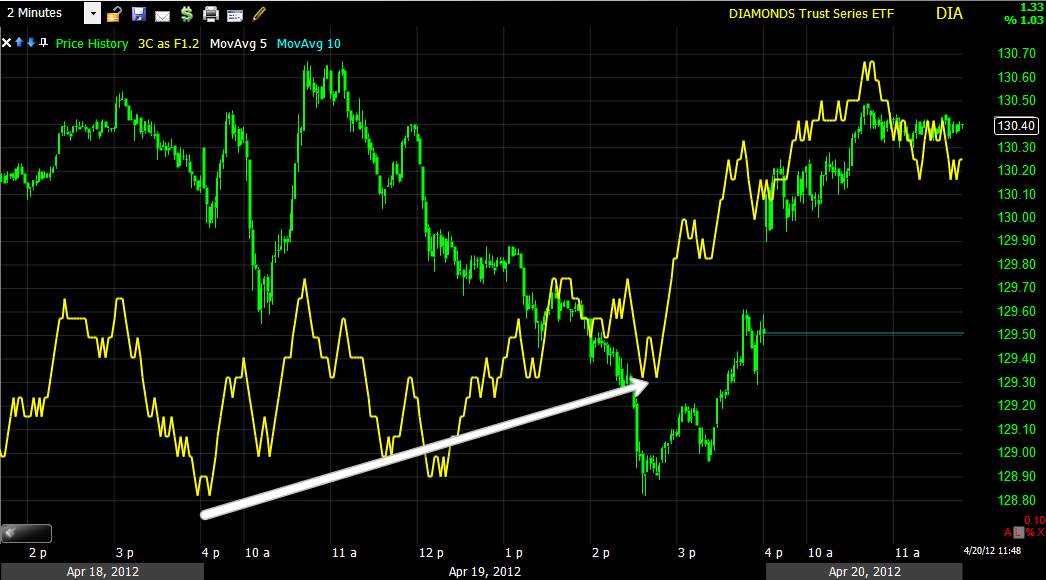
The 2 min positive from yesterday and a somewhat in line chart.
The 5 min showing a small leading negative divergence. The market can rise in to this divergence as this is a reflection of underlying trade, selling in to strength, but I suspect they will still try to get better prices to sell in to if they can.
DIA 15 min looks horrible as usual.
The IWM 1 min with a deep leading negative divergence, remember I never thought the IWM was a real player in a head fake move as there are no really good, obvious levels to break above other than the 50 day average which is around $81.70.
The 2 min IWM is seeing the 1 min negative divergence bleed over.
Oddly the 15 min chart is nearly exactly in line with the IWM's price movement, not sure what to make of that.
QQQ 1 min leading negative

The 2 min was negative near the open, it seems to be picking up a little intraday positive divergence here. I'm not sure where max pain is on expiration for the Q's, but that may be coming in to play.
QQQ 5 min is also showing a bit of a leading positive divergence, I need to take a look at AAPL again.
QQQ 15 min is clearly negative every time the Q's have moved to price strength.
SPY 1 min is slightly leading negative, this may be what i causing the consolidation laterally. It is usually after 12 pm where we see the dollar weaken, that has been a recent trend, so it may do so again and give the SPX some more upside breathing room.
The 2 min is showing a leading negative divergence, again another reflection of selling in to strength, the same thing I want to be doing.
The 5 min is still in line as the 2 min divergence isn't quite bad enough to bleed over yet.
The 15 min is now in a leading negative divergence, as I said yesterday, any price strength will make these 15 min divergences look worse.
Here's the TICK chart, it is very uniform, no big spikes, no trends other than lateral, this appears to be the struggle to manage prices higher while still selling in to them without sending the market crashing lower.


 | Theme by Thur
No comments:
Post a Comment