Tuesday, September 9, 2014

Market Update 1

This is a quicker, more immediate update since the AAPL event starts in less than a hour, I wanted to get a snap shot before and after and the second post will have some more relevant information for the larger picture. Here you'll see the 3C charts with very little relevant movement as well as the near term and cycle deterioration as I mentioned last night, breadth is already failing which at least happened last time as the market was correcting 4-8% down, now breadth is failing while the market is holding in the SPX 2000 area, that's significantly more weakness, but that's exactly what these bounces are used for.


 Again HYG in red vs the SPY in green over the entire August cycle including HYG leading at the base/bottom by days, leading the stage 2 mark-up by days, leading the stage 3 lateral trend/top by days and leading stage 4 decline by days. No matter how many divergences HYG puts in, they are short term 2 min like yesterday that served to only lift the market to VWAP by the close and the SPX above 2000, otherwise, HYG continues toward a lower low and a new trend label for it's Dow trends.

 Here's HYG (red) vs the SPX, you can see it's even leading the market intraday and the trend is firmly in place now for HYG, decline.

 The MSI hasn't done anything in weeks as you can see this morning vs the SPX.

This is yesterday's breadth improvement for the afternoon rally tight to VWAP at the cash close in ES and SPX grabbing 2000, this was HYG's doing with a 2 min positive divegrence, but as I said yesterday, it's not going to change much other than an end of day ramp attempt.

You can see some improvement this morning. Here's where it's more interesting especially considering recent breadth comments in the Daily Wrap posts...

 The TICK indications are VERY weak and we have seen this intraday with -1400, 1500, 1700 and nearly -2000 readings, some of the most extreme I've seen. This manifests in a deeper TICK (red) decay, but the last time we saw this kind of action was on a move down of 4-8% (depending on the average) and as we reached a capitulation/selling climax.  Now we have worse intraday breadth/TICK trend than before and before was so bad it was the SOLE reason I called for a base and bounce (Oversold breadth), EXCEPT now we aren't in a downtrend yet and breadth is decaying this bad, this is like pier pilings crumbling while you walk on the pier above oblivious to what's happening below.

 TICK readings from yesterday at -1700, another today at -1425 and one positive about +1350

The white line is equilibrium or zero.

 SPY 1 min building a slight leading positive, this looks better now since the capture.

The 2 min shows why yesterday I said there was nothing that was going to move the market from accumulation, only HYG, otherwise just in line here.

The Q's are another example of nothing going on except the HYG divergence yesterday sending the market up in to the afternoon.


 The 5 min trend is in horrible shape and lost a lot yesterday, so far today there hasn't been that much decay although the damage is done,, it looks like the market is on hold for AAPL.

 IWM with nothing yesterday afternoon and some deterioration here,  there has been some improvement since the capture.


 The stronger looking IWM yesterday seems to have already given up what I was calling the strongest underlying trade of the major averages.

And the deterioration on the IWM is showing up on the 10 min chart as the 5 is starting to  break down, not like the Q's, however this 10 min chart is similar to the QQQ 5 min.

AAPL should give us a boost, it's just how long it can hold.

NFLX Trade Set-Up Follow Up

We're starting to get that intraday bounce mentioned (SPY was building an intraday positive divegrence as the averages were all red for September). This puts quite a few of the watchlist candidates that are hitting alerts on the upside, on the table for action soon.

NFLX is one of the trade set-ups we've been waiting for, specifically a head fake move. I t appears there was one attempt, today looks clearly to be the second and today looks a whole lot closer. I feel pretty certain that the NFLX short (position trade) entry is going to be right in this area, the timing is the only issue now and there's pretty much only 1 chart that needs to be watched for that.

 The NFLX head fake trade/set-up has all come down to this small resistance area which shows 2 resistance areas, today we have gapped up and pierced both at least on an intraday basis. Volume is higher on the move which is what a head fake move is meant to accomplish so that's a good sign as well.

 Other than the short term capitulation event on 7/22, volume is good. The first attempt lifted volume at the first white arrow from the left and today's move has lifted volume on a move above the resistance zones, again one of several reasons for a head fake move and a way to identify it as being such as these exist not just to fool traders, but for real tactical purposes that are related to trading large positions, especially in a low volume environment.

 On intraday charts there's no confirmation of the move which is a good start, but not an entry in itself.


 The 5 min chart  is the one to watch. The first attempt to break resistance and breakout was met with distribution (resistance at the first yellow trend-line from the left) which created a new resistance level, but the resistance zone is really more important than the exact level and the broad psychology of the move, it needs to be convincing.

The second attempt today is seeing a deeper leading negative divegrence, IT'S THIS CHART I WANT TO SEE REALLY DETERIORATE FOR A TIMED ENTRY, OTHERWISE, NFLX IS ALREADY THERE ON A STRATEGIC BASIS.

 The 15 min chart moves from in line to leading negative on this leg (The August cycle) so it's already giving good signals which should deteriorate significantly more once the 5 min loses its footing completely.

 As for the longer term or strategic point of view, NFLX has been ready for a while, the trend has been strong distribution, it has just been a matter of the best entry with lowest risk and best timing. This 60 min chart is drawn like the first two negative divergences were relative (the weaker form), they were actually leading negative, but I do that just to show how bad the last run (August cycle) has been as it has moved completely in the other direction, one of the best looking divergences out there and one of the reasons I like NFLX short so much.

Of course on an even longer term basis, the 4 hour chart shows what the resolution of highest probability is,  the odds are VERY skewed in our favor for a very ugly move to the downside and a beautiful short trade.

Remember, I'm going to be looking for the 5 min chart at this point, but I think we are pretty much in the location as we have been for the past several weeks.

AAPL (Call Position) Update

The AAPL Sept 19/20 $96 calls are at a slight gain, their opening indications fell short of confirmation. The obvious reason would be market weakness, but there is a leaked video claiming to be of the I-Phone 6, apparently if this is the new I-Phine, there will be some disappointment.

For now, the open doesn't look great as far as confirmation, but the 5 min chart has PLENTY of gas in the tank to take this much higher and there's likely still that market maker problem of having been stuck with @ Market orders on the 3rd of Sept. so that alone may be justification even with disappointment for at least a knee jerk so they can unload their stock at better prices rather than be behind the 8-ball.

 The opening intraday chart didn't confirm for AAPL, usually I'd be a little concerned with this, but considering all of the major averages are red for Sept. and it's early, I'll stay my hand.


More importantly the 5 min chart is leading with quite a few days in this small stage 1 bounce base.

All Averages Are Red for Sept....

The AUD/JPY is leading the market down with $AUD weakness hitting 9 month lows. USD/JPY seems to have lost all correlation as we have been seeing, to equities/Index futures, rather it seems like yields like the 10-year have been set to correlation very different than the last several years, but hints of this have been surfacing for weeks as well as Treasury weakness with TLT almost 2 weeks ago.

The $USD just hit 15 month new highs on $AUD weakness.

Right now the SPY is trying to put in a positive intraday divergence. I think we'll see a bounce here momentarily and asses the damage on that bounce.

As for AAPL calls, for now I'm leaving those open.

I have numerous alerts triggering which would make sense for them to make their runs before it's too late, I've been trying to keep up with those.

I'll also have an MCP update out shortly.

So did the F_E_D tell Citadel to reprogram the USD/JPY pair away from ES/SPX futures and to yields? It sure feels that way.


Monday, September 8, 2014

Daily Wrap

I love the poignant comments of John Hussman in his weekly market commentary because it's something I've talked about a lot recently in saying that all of the red flags are there, the latest Investors Intelligence survey (a contradictory indicator at extremes) shows the Bull/Bear ratio out of control with the fewest bears since 1987! Usually my comments that have followed have been along the line of the red flags everywhere and how in retrospect, everyone will say they saw it coming, people just have a short memory, a lack of experience or imagination to understand what it's like when the damn breaks.

So in Hussman's commentary for the week, this just stood out,

"There’s no question that the absence of consequences – to date – has led investors to believe that those consequences simply will not emerge. Once the consequences arrive, the preceding bubble seems obvious, but it’s a regularity of history that speculative episodes are only completely clear in 
hindsight."

He carries on...

"History teaches clear lessons about how this episode will end – namely with a decline that wipes out years and years of prior market returns. The fact that few investors – in aggregate – will get out is simply a matter of arithmetic and equilibrium. "

He goes on a bit more about the history of Corporate buybacks which have been the biggest buyer in the market recently and how historically corporate buybacks are always at the top of a bubble on borrowed money, whereas the place that it makes the most sense to buy them from a corporate value perspective is near market bottoms, but just like the herd above, they do the exact opposite with some nice charts proving it. In any case, it struck a chord, from the "greater fool" aspect, from the "MArket bubble" aspect, which I sent a lot of timing studying going back over 400 years and they're always the same, although their defining feature is that each one claims, "It's different this time". I also identify with it from the bear market/fear perspective and how quickly fear wipes out years of gains in months and while you might think, "OK, well take the gains and get out before or at the decline". The other comments he made were that, "

"The fact that few investors – in aggregate – will get out is simply a matter of arithmetic and equilibrium."

which is something you just have to see and live through to understand it's true. I suppose it's sort of like the attitude of taking an initial loss and saying, "Well I get out on the next bounce as close to my entry as possible", but that bounce never comes, something much worse follows and the trap is set. I know it doesn't seem logical, but it's just like the corporate buybacks at all time highs at the top of a bubble on borrowed money rather than with cash at much cheaper prices at the lows of a decline, who knows why people do what they do, but they ALWAYS do it. In any case, just something I identified with having been through several of these episodes and having studies dozens more.

The one thing that I can't relate to, but just imagine on probably a very hollow scale are the consequences as this is a ginger bread house that we have never seen on a global scale never seen before. As Howard Marks recently observed,

"I don’t think it’s too early to take today’s carefree market conditions into consideration. What I do know is that those conditions are creating a degree of risk for which there is no commensurate risk premium.”

Although I try to imagine all of the ways this market is unique and all of the ways it has no historical precedent and how all of these things coming together create a perfect storm, the fact is, once things start  a chain reaction, I don't think there's anyone (as Janet Yellen admitted in saying she didn't see the Credit Crisis coming) who has the immagination to understand what the true risks are, but I do think they are beyond historic and our comprehension and in that we find opportunity and after that stage completes, we find new opportunity, not that it will be easy to see or seize, but that's the market. Just an interesting aside I thought I'd share since this topic has come up frequently.

As for today...

I feel 100% vindicated in Friday's The Week Ahead post, in which for months we have called the next week with uncanny accuracy so it's not that I'm afraid to make a call, it just wasn't there which led me to post the following...


"Usually we'd have some very strong short term signals and we've been able to call the week ahead action pretty accurately, at least the trend, the timing may be off by a day or two.

I don't see anything that's standing out in the averages either way so if I had to make a call, I'd say more of the same, more lateral chop which in the cycle is stage 3 top/reversal process, the size of it vs. the size of the base is what we've observed numerous times in the past so nothing is out of the ordinary there."

Considering the closes in the averages, SPX -0.31%, NDX +0.14%,  R2K +0.19% and Dow-30 -0.15%, the market did exactly what the "Week Ahead" post was looking for, at least early on for the week, MORE OF THE SAME. While this isn't the action I'd like to tell you to get ready for (a lack of action), this was what 3C was giving us. The post continued...


 "I saw a carry trade shoot up like a rocket last night and Index futures that would normally follow it tick for tick, completely ignore it."

And what happened today? The USD/JPY carry trade shot up like a rocket to 5 year highs hitting stops at $106 and THE MARKET COMPLETELY IGNORED IT, IN FACT WENT THE OPPOSITE DIRECTION, charts can be found in today's post, $USD Causing Havoc. There's more to this than a glitchy day. The post continued...

 "I've seen the second attempt at an HYG positive divegrence (short term) completely fail today and I've seen HYG lead the market consistently by 4 to 7 days, it's solidly in stage 4 decline."

Of course I've covered this more than once, but for the latest on the HYG situation, I updated that here today, EOD Market Update and I firmly believe this will have been a very obvious signal, however when you watch the market tick by tick all day like most of us, you expect things to happen faster which is just a cognitive bias. When you look back on a daily chart, timing and signals make perfect sense, sometimes it's just too easy to get lost in the lines. And finally...

"I think we'll get our opening to the shorts, SCTY just hit another alert. I don't think it matters really whether the market can pull off a head fake or not, the assets we are looking at as trades, are doing what we need them to do.

Based on breadth, HYG and multiple other things noticed this week (no follow through, ECB flop, etc), I feel pretty strongly the market will enter stage 4 decline sometime next week and I think we'll be glad to have entered and filled out the shorts that we are looking at."

Today at least 7 of the "Trade-Set-ups" triggered alerts on the upside, the direction we need to see them move for our set-ups, even as the market was weak intraday. As for stage 4 this week, we'll just have to wait and see if that pans out to be correct, but I have no problem updating forecasts when new information is presented as long as it's unbiased, objective data.

All that being said, even as the day on the whole came in pretty close to flat with two averages up a little and two averages down a little and in a choppy range, nearly all asset classes saw significant intraday weakness, from Treasuries gapping up and ripping down (although on a daily chart they're practically unchanged from Friday), oil gapped down and pressed back up to nearly unchanged, gold and silver were down about 1% on the day and seem to be answering the question, "Is the $USD legacy arbitrage back after years of F_E_D carry trade inspired disappearance?"Just based on GLD, SLV and GDX alone, it seems that's the scenario I've been questioning for a week or so,  however today's action in stocks almost seemed to verify it, although 1-day does not make a trend, however last Friday in the early a.m. hours the same thing happened with USD/JPY and Index futures.

The close was absolutely predictable, from this afternoon, EOD Market Update ... The SPX recapturing 2000 now crossing over and below $2000 lord knows how many times the last 2 trading weeks and as usual, the EOD ramp to VWAP...
ES moves to VWAP by the close as usual and SPX recapture $2000 on the close.

All of these things seem like drudgery, they're predictable, they're rather boring, it's hard to see anything but small moves and chop with an overall lateral trend, but if you are paying attention to the details, the market will almost always speak to you.

Take the NYSE TICK for example, last week I saw one of the lowest readings I can recall at nearly -2000, today we were near -1400, then -1600 and then -1650 on top of last week's (Thursday's) nearly -2000 reading, this is not boring drudgery, this is a message from the market. 

Of course the biggie may be the $USDX Legacy Arbitrage which you may not be familiar with if you've grown up in the markets since 2009 or so, but just about every dollar denominated risk asset from oil to gold to treasuries, commodities, stocks, typically move opposite the $USD, that has not been the case with the carry trades open, it has been the opposite as risk assets follow the $USD in pairs like USD/JPY, however that went out the window today and we suspected that may be happening at least a week ago after seeing some things with gold/GDX and a few other assets as well as the USD/JPY overnight ramp on Thursday early a.m. that saw Index futures go the opposite direction.

5, 10 and 30 year yields were moving with the $USD, however this is something we anticipated over a week ago with this post from, August 26th , TLT / Treasuries, when we predicted (via 3C) a decline in treasuries which are now well below the Aug. 26the level in which we said to look for a pullback in TLT and Treasuries so there are a few forces at work , some from almost 2 trading weeks ago, some from today.

You saw with your own eyes today these breakdown in correlations from $USD Causing Havoc...
 This USD/JPY vs. ES/SPX futures (purple) was probably the most visually shocking.

However we saw the same in Crude suggesting the historical arbitrage is working its way back in and...

Of course gold which is not new as this was posted last Thursday Sept. 4th in ECB Actions / Daily Wrap

"If you want to know why gold , silver or oil were lower, look no further than the $USD strength off Euro weakness"

And while the closing prints seem like nothing is happening (except the fact that this is exactly the kind of price action of a stage 3 market and a clear departure away from the former 10-days of stage 2 mark-up), if you are paying attention, volatility is picking up. As mentioned today, half the market made a 1 week intraday low Friday and the other half made a 2-week intraday low Friday. 

The point being, just like a transition from stage 1 to stage 2 or stage 2 to stage 3, all transitions are marked by volatility right before the transition,  you may recall the late stage 2 charts I've posted in which price peels away from the trend on the upside in a seemingly bullish move just to move in to a stage 3 top, it's almost always a dead giveaway so long as you view it within proportion. It's really not any different than the "Channel Buster" concept.

Volatility intraday is definitely picking up.

While I believe firmly HYG is going to lead the way (is leading the way as it already has and has so many times in the past)...
 This chart shows HYG (blue) vs SPX (green) since the start of the August cycle with HYG's stages on the bottom and SPX's right above them, HYG  has clearly led which is why it's one of our most used Leading Indicators.

However as predicted in the EOD update and through the day as HYG 2 min positive divergences were building, HYG looks like it was the lever that led the SPX over $2000 on the day and led ES/SPX futures PERFECTLY to VWAP at the cash close... once again as it's just too silly to think anything other than "manipulated"...
After busting through a downtrending VWAP as well as its lower standard deviation intraday, the close magically lifted right to VWAP and HYG moved exactly in line with the SPX after building an intraday positive divegrence all day. If HYG is the only lever they have, they've got trouble because that divegrence wasn't past 2 mins.

Our Professional Sentiment Leading Indicators, they have been in decline at least since 11 a.m. Thursday and they have been very useful for short term moves, although like HYG, they will call large divergences that are market moving.

Spot VIX has quietly been creeping up making lower highs and on a 5-day chart has a bullish reversal candlestick in place. I have mentioned numerous times how VIX has one of the cleanest reversal processes in the market, of course with the exception of HYG.

High Yield Credit seems to have topped on 8/27 and continues to post wider divergences vs the SPX.

There was no dominant Price/Volume Relationship today which isn't surprising considering the continued divergence (no matter how small) between the major averages.

Only 3 of 9 S&P sectors closed green with Tech leading at a +0.15% gain, Financials and Healthcare barely closed green at +0.04 and +0.02 respectively.

On a 2 trading week basis, the Defensive Utilities and Healthcare lead with +2.14 and 1.89% respectively,  the loser is Energy at -1.48%.

 On a 4 trading week basis, the Defensive Utilities and what has become a defensive Healthcare sector lead the market by a wide margin at +7.29 and +6.72%, in last place in Energy at +0.52%

Of the 239 Morningstar Industry/Sub-Industry groups, only 81 of 239 closed green today, with only 49 posting a gain of +0.25% or more.

Our Most shorted Index hasn't led a short squeeze for quite some time, that may have something to do with the results of the Investors Intelligence Survey with bearish sentiment coming in at 27 year lows, not seen since 1987 and you may recall that was an interesting year for the market. In fact, the MSI if anything, has shown more steep drop-offs than steep short squeeze moves over the last 12 days.

As for breadth indicators, I showed you how they came off the oversold lows that convinced me to put out a call for a base and bounce on July 31st after the close which started the next day on Aug.1.

Then after 10-days of rally, breadth got out of the oversold zone, but still very poor as it has been getting worse all year. We had been nearly flat for almost 2 weeks with no breadth movement at all, seemingly the market gave as much as it was going to give back. Last week,  I said these breadth indicators are now rolling over (bearish) again, despite the market essentially treading water, this is exactly what we saw at the 2007 top and are already amore extreme now than at 2007.

Today several of these breadth indicators which are not interpreted, they are hard numbers, like "The Percentage of NYSE Stocks Trading One Standard Deviation ABOVE Their 200-day Moving Averages'" has rolled over today to a new 15 day low.

"The Percentage of NYSE Stocks Trading Two Standard Deviations ABOVE Their 40-day Moving Averages'" (Momentum stocks) has also rolled over today to a new 15 day low.

"The Percentage of NYSE Stocks Trading One Standard Deviations BELOW Their 40-day Moving Averages'" (weak stocks) have hit a 12-day high."

"The Percentage of NYSE Stocks Trading Two Standard Deviations BELOW Their 40-day Moving Averages'" (very weak stocks) have hit a 15-day high.

The NASDAQ Composite Advance/Decline line which has been deteriorating all year, but in really bad shape since late June, has now hit all time wides between the Index and the A/D line (the A/D line diverging negatively).

The bottom line, even as the averages (for the most part) are ranging in stage 3, market breadth not only stalled, but is back on the decline which if left in this trend with the major averages holding the area with declining breadth, we'll have an exceptionally shallow/hollow market primed for a fast, sudden decline as there are fewer and fewer stocks to support it, which is a trend throughout 2014, but especially bad since late June and especially bad since July 31st.

For instance,


"The Percentage of NYSE Stocks Trading Two Standard Deviations ABOVE Their 200-day Moving Averages", as you can see, the support they gave the market (although not making higher highs) back in late June is VERY different than the lack of support for the market now,  THIS IS EXACTLY WHAT HAPPENED AT THE 2007 TOP, EXCEPT WE PASSED THAT THRESHOLD ABOUT A MONTH AGO.

AAPL is the event tomorrow, the divergences it ended with today are not much different than the ones posted today in, AAPL Charts. Because of this, I'm sticking with the same short term and longer term trade set-ups.


EOD Market Update

I can't find any divergences that would be even worth positing as far as today's intraday decline being accumulated to help push the SPX back above $2000 and have the market in decent shape (at least not -.75% decline), the day before AAPl unveils their new IP6.

I couldn't find anything in the $USD either, the only lever that looks active (at least until I see the updates internals after the close) is HYG as expected earlier today and the last couple of days. Translation, there's no market divergences for any market support beyond what was already there and in most cases 3C intraday is either in line or has lost ground, but HYG is a different story, also a few of the stocks on our watchlist/Trade Set-ups, have been hitting some alerts so there's a little support coming from market breadth intraday, however nothing from the MSI (short squeeze).


You can see intraday breadth improving...
 After a large intraday breadth decline this afternoon has a small area of improvement in to the close as would be expected for where we are right now (relative to the week ahead post, AAPL, etc.), however there's no doubt that the selling bouts are much bigger and stronger than any upside ticks (recall the -1400 to nearly -2000 TICK readings).

As far as I can tell, it's all about HY Credit, HYG specifically.

After a couple of failed positive divergences, it has a decent 2 min here, still it's 2 min, that's a pretty small divegrence I wouldn't even risk trading.

 Intraday HYG has underperformed the SPX, but this isn't of too much importance, what is...

The leading position HYG has had vs the market since August 1st, which has nearly been to the day, it's clearly leading the market lower so it will likely get a little corrective bounce here that helps the market out and back toward a new lower low and a trend change with the market (I suspect) hot on its heels.

AAPL Charts

These are the AAPL charts from this morning which was why I posted , AAPL Reiteration on what looked like an AAPL intraday pullback before their big unveiling of the IP6 tomorrow and the harts I was looking for to confirm the pullback.

 This was the intraday negative from this morning's post linked above and why I thought AAPL might pullback and why I might consider adding to Friday's AAPL call position if the signals on the pullback looked good.

 The intraday 1 min signals looks decent, it probably wouldn't do it for me alone without some market help which I think is coming by way of an HYG divergence which I'll post soon and of course the "Get shorty to $2000" in the SPX.

 I always want to see some volume on this type of move, some stops run and it looks like some nervous hands were present around $98.50

However as for AAPL, it has been this 5 min chart that has been of greatest interest for this particular position and it is leading positive today on the pullback.

As I said, I suspect some market assistance which I suppose goes both ways with AAPL's weight, HYG, although this isn't anything I'd consider to be any more than a helping hand on a very short term basis like the AAPL calls position, has been working on its positive divegrence today now that it seems the carry trades aren't a useful lever anymore. Maybe we'll see more record number of odd lot and 1 share trades again?

Trade Idea: AAPL 9/19 $96 Calls

I mentioned earlier I may bring the AAPL speculative call position from Friday up in size if the intraday pullback signal that was there this morning panned out as it did, the position will still be speculative in size, just a bit bigger.

$USD Causing Havoc

Earlier in this morning's, A.M. Update I had mentioned that most of the overnight action was in currencies, especially the GBP/USD on the news of a poll that most voters would vote for the upcoming (Sept. 18th) Scottish independence referendum. There has been weakness in that pair, the EUR/USD and in the Yen (The Sterling, Yen and Euro have all been weak ), this has sent the USD/JPY up and the $USD/JPY up.

Looking at this chart,
you might think this is some sort of divergence indicator,  this is the dislocation of ES / SPX Futures (purple) from the USD/JPY which it has tracked nearly tick for tick for years as a Carry Trade.

*Note the USD/JPY just hit 5 year highs, running orders/stops at $106. 

You may recall recent musings on the site as to whether the end of US QE is going to revert the $USD back to its historical Legacy Arbitrage relationship which has been completely skewed due to the F_E_D and carry trades over the last several years, instead of running from $USD strength, they've been following it, but the last few weeks there has been some question as to whether this historical correlation between the $SD and nearly all $USD denominated assets like gold, silver, oil and even stocks was once again returning back to the historical inversion.

While a few days/weeks is hard to call a trend after years of another trend, the timing does make sense with F_E_D QE coming to an end and some of the other sovereign issues in each of the countries mentioned above.

Here are some other correlations... *These charts show the $USD in purple and the comparison asset in candlesticks*
 $USDX vs ES/SPX futures on a 1 min chart, the correlation is just like the historical Legacy Arbitrage $USD correlation in which stocks, most commodities like gold, silver and oil move opposite the $USD.

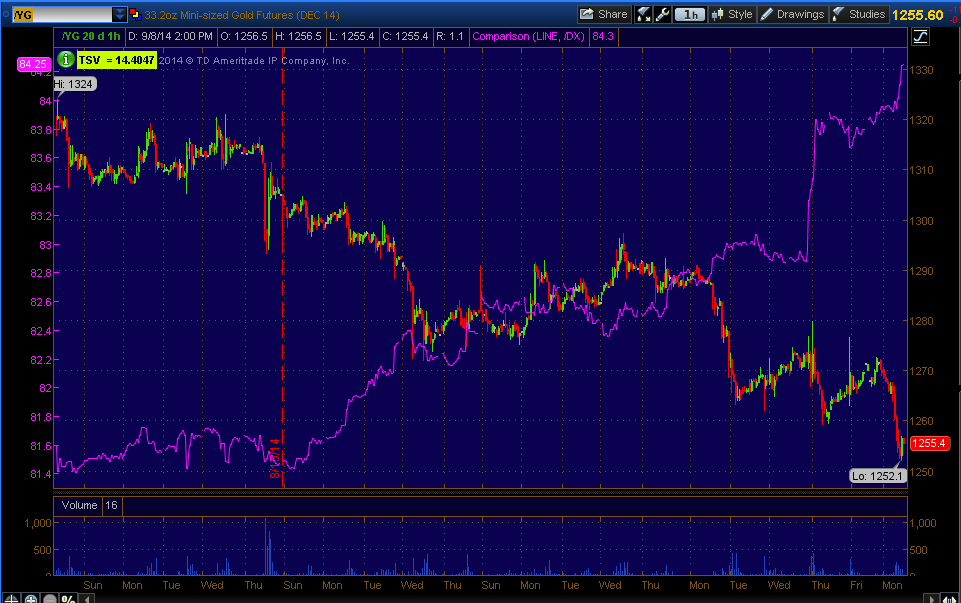
This 60 min chart of $USDX (purple) is against gold futures, it does seem that there has been a recent pick up of the historical correlation. I can't find any other good 3C reason beyond the pullback we expected about 2 months ago in gold and gold miners, this does seem to suggest that the $USDX correlation is at least exacerbating the situation.

 This is the $USDX (purple) vs Brent Crude Futures intraday.

 And $USDX vs Silver futures (10 min).

Even Treasury futures are moving opposite the $USDX and down...

And the $USDX which seems to be gaining strength on a weak Sterling (GBP)...

 As well as weakness in the Euro

And the Yen...

If this historical legacy arbitrage sticks, there's another very large multi-year change in character.


IBB / BIS NASDAQ Biotech Follow Up

Here are the charts for IBB (NASDAQ Biotech Index) and the asset I prefer, BIS (long), 2x short NASDAQ Biotech Index.

 This is the 60 min IBB (NASDAQ Biotech Index) as opposed to the 2x short, BIS which I'll be comparing to save some charts. This looks like a double top , you can see the strong distribution at the first top and the accumulation between and an even stronger leading negative divegrence at the second top.

I suspected after Yellen had come out and said "There's no bubble in the equity market except biotechs and social media stocks" (paraphrased), we'd likely see a biotech rally which would enable any longs to let go of their shares in to better prices, rather than what most people assume, an all out, instantaneous panic,  this is why I wanted to wait on the second half of the BIS position.

We also have some interesting post European close weakness mentioned earlier. Although in the week ahead post from Friday my expectation was for more of the same which is largely lateral chop which is getting more volatile, that doesn't mean I expect underlying flow/signals to remain the same, especially if we are to enter stage 4 this week.

For instance, this QQQ 5 min chart is showing quite a bit of weakness not only through the trend, but today specifically.
 While the BIS position is not in direct response to the weakness in the market today, it does have a little influence on the one issue I had with bringing BIS up to full size rather than 3/4 size and wait, that was the daily chart. With today's additional weakness on top of everything else, it does have some influence on my decision, but I wouldn't be considering BIS if it wasn't standing on its own two feet.

Note the leading negative 5 min divegrence from today only thus far between the two red hash marks.

Earlier today we had a nasty NYSE intraday TICK extreme of about -1400, since then two more extremes have come in at -1650 and nearly -1700, these are the kind of extremes rarely seen, in fact last week we started seeing some crazy readings I haven't seen before near -2000. As a reminder, the TICK is the number of NYSE advancing issues less declining issues and anything < > +/- 1000 is a strong reading, at 1250 extreme.

 You saw the IBB 60 min leading negative, this is BIS, the 2x leveraged inverse ETF with a leading positive 30 min chart (60 min as well, but I'm trying to show the most timeframes and confirmation with the fewest charts).


 IBB, the NASDAQ Biotech Index's 10 min chart wwent negative and leading at the recent highs.

 While BIS's 5 min chart is leading positive in a rounding reversal area.

 Shorter term IBB's 3 min chart is leading negative as well...

As is the intraday 1 min chart, which I'm less concerned with and more concerned with the 5 min -60 min charts.

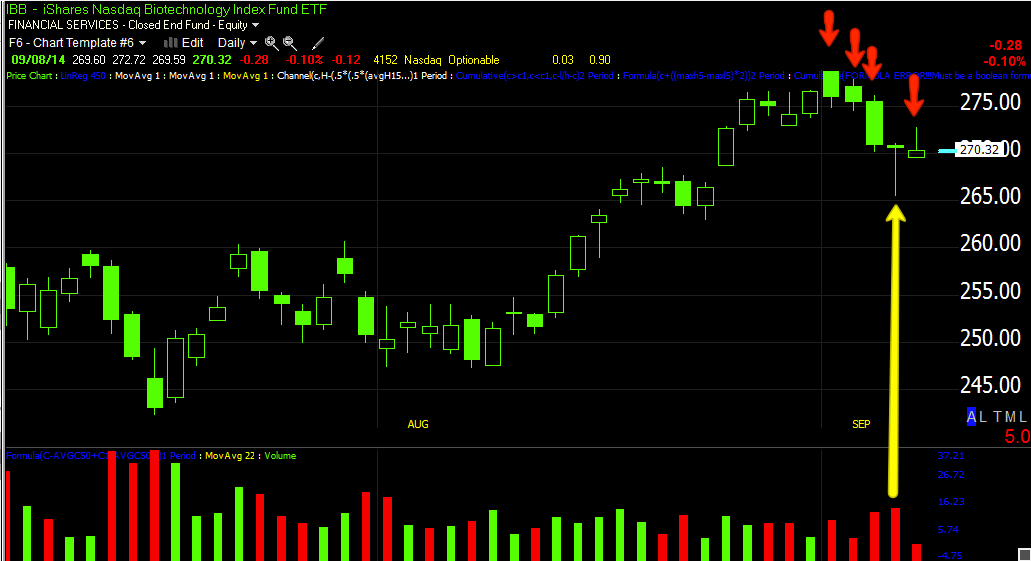
This daily IBB chart and the hammer put in on Friday on increasing volume is a bullish reversal, there's no implied target, in fact all the hammer does is say that the current trend (down) is likely to halt, but there are 3 trends, down , up and lateral, so while we usually think of a hammer as being an upside reversal (with no target, it could be a day or a month), the fact is literally it's just telling us that the trend in effect is going to change (and again we don't know for how long), which means lateral or a consolidation is a possibility as well.

Today's daily candle is not looking very good with a long upper wick and a very small body and the fact is, even if it were to bounce to a new high from here, I'd be looking at 3% drawdown which is really nothing , especially in perspective of the longer term position trade. This is where I had to take today's 3C weakness and TICK weakness in the market overall and the NASDAQ in specific, in to account.