At the September meeting and announcement of QE3, 3C was negative in a big way and we saw 2 days of volatile upside (approximately) and then that move went sideways for a while and then failed and took back all QE3 gains in a day and fell to lower lows despite the "Conventional Wisdom" and the mantra, "Don't fight the F_E_D". We were dead on right about that move, the signals and the information we collected after that suggested we head lower rather than up as everyone expected.
If we were to get a little more upside and that was the knee-jerk move and then a reversal to the downside, it would fit with all of the current signals. I find leading indicators today interesting as they are in better position than the SPX, which is something new on the day for most of them, the only one that stayed negatively divergent in the intraday timeframe was High Yield Credit, but HY Corp. Credit and Junk both showed better relative performance as did yields although longer term they are massively negative, even the Euro held up better than the SPX today, this in some way suggests to me that the upside the QQQ charts are still flashing in 3C positive divergences, as they HAVE NOT clearly taken out resistance, may in fact not be coincidental when looking at leading indicators intraday, the take away being we get more knee-jerk upside before the longer term/stronger negative market divergences finish taking the market lower from the 11/16 bounce.
As you might know, the media outlets have the F_O_M_C statement BEFORE it is released, it is under embargo and while I was looking everywhere for a sign of a leak or something we could use, I didn't find anything until JUST BEFORE the policy statement was released, it seems someone did know something as I posted today at least 2 major 3C divergences that predicted market direction before it happened. Both (actually 3) signals were all in volatility ETFs like VXX, UVXY and XIV here was the first unambiguous, clear leak before the policy statement.
"The intraday volatility charts like VXX and UVXY are seeing very short term 1 min or so 3C negative moves, they are quite fast, XIV which is the opposite is seeing a positive move.
Also the IWM 1 min has seen some very recent 1 min positive movement, perhaps the initial reaction in the first few minutes is bullish. This isn't long enough or big enough to draw any conclusions beyond that." 12:29 p.m.
Here's the move, remember what I said about initial direction...
XIV w/ the chart backed up to 12:29, 1 minute before the policy statement...

A fast forming XIV positive divergence, when XIV rallies, the market tends to move in the same direction, the accumulation suggested that the initial market reaction would be positive and here's the SPY reaction...

Initially positive as the statement is released.
Then at 2:16 p.m. I posted this... during Bernie's press conference
"Earlier just before the F_O_M_C I told you there were negatives in the intraday VXX and UVXY, which is market positive and would indicate and initial favorable response, XIV was positive so it confirmed.
Now they are flipping, they were reliable last time intraday, will they be again?
XIV is seeing a negative, it is the strongest signal.
VXX and UVXY are seeing more positive signals so this suggests the market comes down at least intraday in the near term, much like the market averages." 2:16 p,m,
The charts...


The SPY/Market did fall right after the volatility indicators saw their divergences flip and this time suggest market downside!
How in the world? I now we see it every day, but right before a policy statement 3C is telling us which way the market will move initially and then it flips and tells us to expect the opposite a little later...
"Those divergences are still in place right now, UVXY and VXX positive, XIV negative across the intraday timeframes from 1, 2, 3 and 5 min with leading divergences and 10 min charts with charts that are starting to lead. A lot of the longer term charts have been in an overall positive position.
We'll see how the close goes, but I thought I'd let you know these positive divergences continue.
Remember also before the F_O_M_C the signals were the opposite suggesting the market initially move up so these indicators and their signals have worked 3 times today thus far." 3:37 p.m.


And UVXY was positive even on longer term 10 min charts, which are more powerful signals, this 10 min leading positive would also send UVXY higher and the market lower.
So what did the market do between the 2:16 post and the 3:37 post saying these assets should keep downward pressure on the market?


Here's the SPY from 2:16 to 3:37 when the last 2 posts about these volatility ETFs were written, as you can see they kept pressure on the market the entire time, but they were giving these signals before the market moved, like at the white arrow, just a few minutes before it headed lower!
I think the first one may have been a leak because it predicted market direction before the policy statement came out.
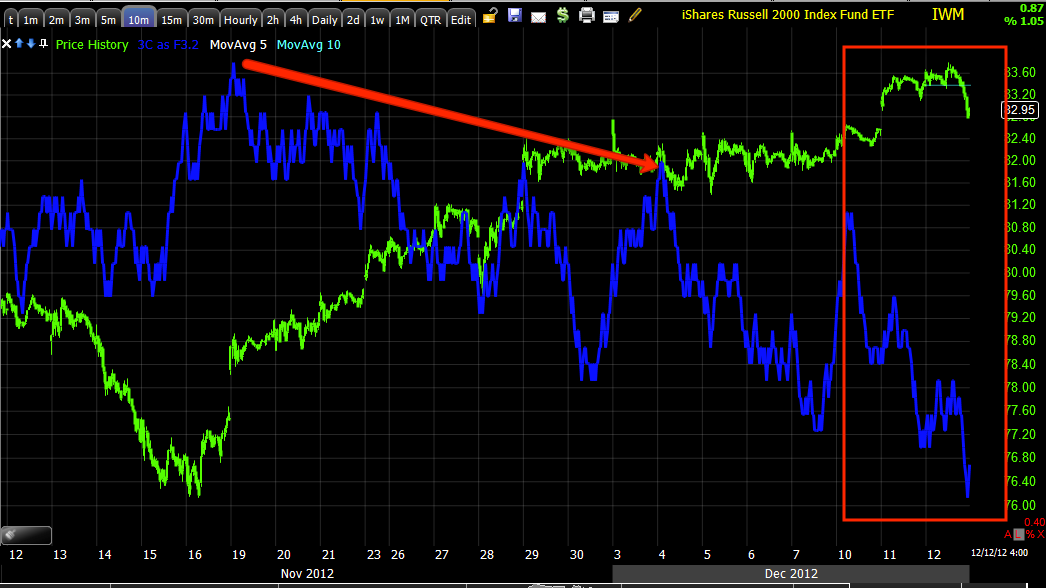
As for the market averages, they saw some pretty dramatic negative leading divergences today as most of them popped above technical levels like the IWM's range or their 50-day moving averages, this suggests heavy distribution in to the last few days of upside preparing for a hard move to the downside. However there are a few charts that have 1 min positives, it's not much and it may be nothing, but it may be enough to move the market a bit more and clean up the QQQ breakout that is a bit ambiguous right now.


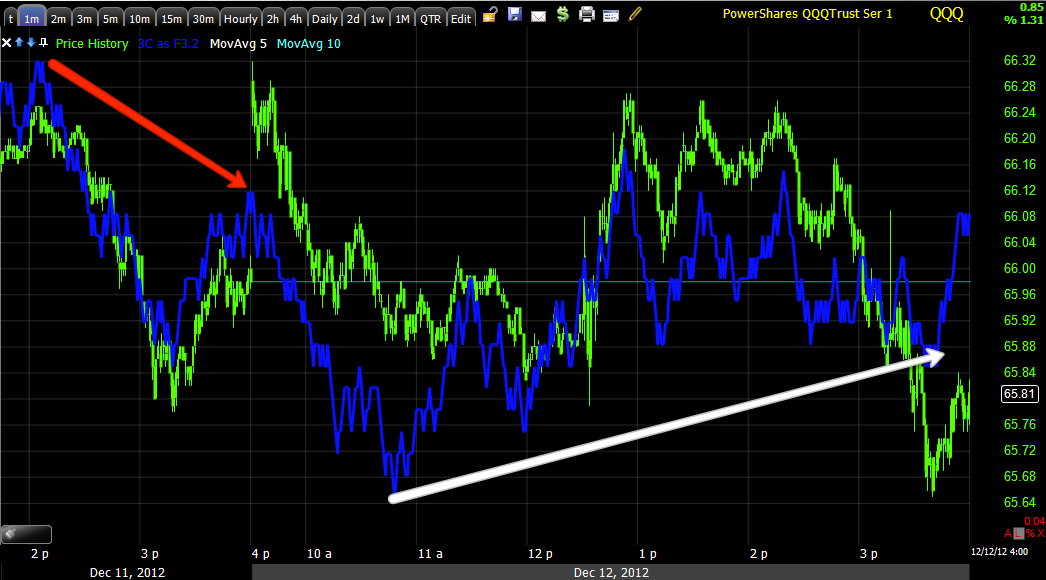
Another on the QQQ.
Taken with leading indicators, I wonder if the QQQ won't try to breakout. I still feel strongly we will see a very sharp reversal to the downside before this is over.
As for futures, they aren't telling us much, but there are some hints.
S&P E-mini Futures (ES)


NASDAQ E-mini Futures (NQ)


NQ 15 min with a large relative negative divergence and a very small positive. All in alll this is the continued deterioration I wanted to see on longer term, more important charts.
We'll be watching closely again tomorrow for opportunities and to see what the real knee-jerk reaction will ultimately be so we can fade it, I'm thinking a move up, then fade to the downside.
See you in a few hours.


No comments:
Post a Comment