You lose 1 divergence or so it seems and you find that it's just part of creating a bigger divergence, the DIA is a decent example of that, but the DIA is also a good representation of the "Razor's Edge" we are on. I want you to see first that there's a small divergence in place that could lift us from here, but the larger divergence, the most serious trend and the highest probabilities are down and we are sooo close to that area that I wouldn't be long the market here at all and I do feel comfortable adding to short positions or initiating new ones which I will cover. I'm only using the DIA just to sped this up.
DIA 1 min which was leading earlier went to a small negative divergence at this top and price making a new low without 3C means this is a larger 1 min positive divergence.
The DIA 2 min was leading to the upside, the pullback to new lows didn't pull 3C out of leading positive position so it adds to the size of this intraday positive divergence as well. This is where it stops for the DIA for now, these are intraday moves only.
The 3 min is not seeing migration of the divergence from the 1-2 min. charts, it's negative at yesterday's F_O_M_C top and in line since, that's price/3C confirmation.
Here's where it gets dangerous for the market...
This 5 min leading negative divergence is a stronger signal than any above, it is in to higher prices from the last several days so the move up that was set up starting late Tuesday of last week has been sold in to the entire time, but passed some areas where bulls would buy, making it easier to sell in to higher prices and demand.
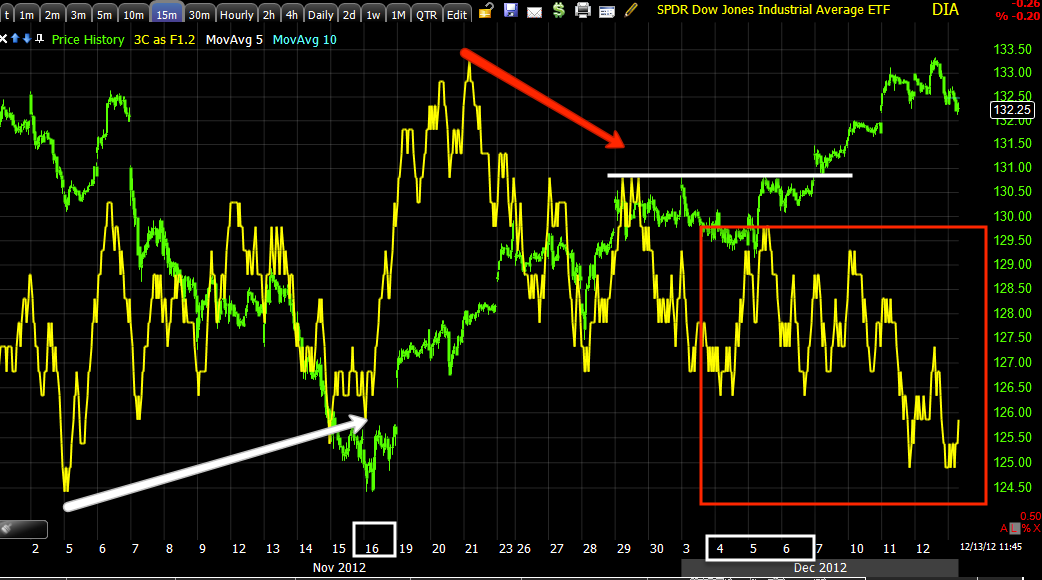
The same 5 min chart in scale since the bounce started on 11/16, the white box is where we saw that positive short term change in the market, you can see what it did with price, lifting it above local highs and the 50-day moving averages, that creates buying demand, but look at what smart money was doing with that demand from retail, they were selling or selling short in to it the entire time so we now have a leading negative divergence at a very deep low, below even where 3C was when price was at the lows of 11/16- VERY DANGEROUS as this market is right on the edge.

Not that we even need it, but the longer 15 min chart which carries more significance/stronger signals/distribution is also leading negative sharply, again in white the area of accumulation that built last Tuesday and Wednesday, you can see what it did to price, you might want to go back in the archives and read the market updates from that Tuesday, 12/4 just for some perspective.
Again, a VERY DANGEROUS place in the market, a ripping move to the downside could be right around the corner.


No comments:
Post a Comment