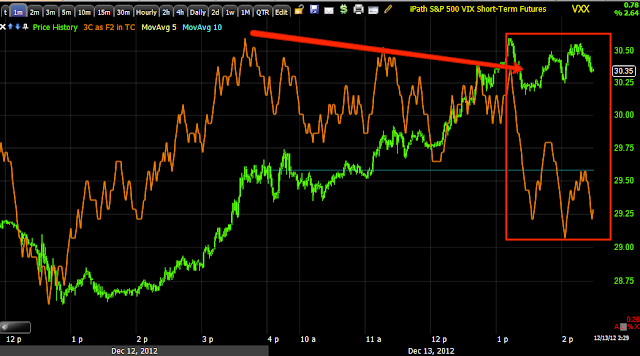
Yesterday in several posts I used 3C signals in Volatility assets like XIV, VXX and UVXY to predict intraday market movement, the first time BEFORE the F_O_M_C statement and I said the indications are that the market initially moves up, and then around the press conference I posted again that these 3C signals on these 3 assets had flipped and to look for intraday downside, that came about 10 minutes later and the 3rd post said the divergences remain, so I expected price weakness to remain, it did and it has so far today.
Here's last night's post in which I linked to all of the posts above and also included charts and exact times so you can see how we predicted the market BEFORE the policy statement and after.
We have some more interesting developments, I would summarize them as short term positive for the market, perhaps in to the close, maybe part of tomorrow (we'll have to let the signals tell us) and a longer term set of signals that are market negative (this is exactly what our expectations have been, this is exactly what I have summed up so many times " A fast/strong move above resistance followed by a fast reversal and a longer, stronger move to the downside".
I don't usually like these for analysis as they can be tricky, but these signals worked 100% yesterday and they are there now confirming other things I've already seen.
UVXY (VIX Ultra Short Term Futures) These move opposite the market like the VIX so a move up in UVXY correlates typically with a move down in the market if there's feat.
We have a 1 min negative divergence, the same timeframe I used yesterday as nothing else was giving signals, I stumbled on these just as they were moving fast just minutes before the F_O_M_C statement, someone knew which way the market was going to move initially right after the statement.
This suggests UVXY comes down short term or intraday even, that should support the market to head up over the same time period.
UVXY 3 min is showing migration of the negative divergence from the 1 min chart so there's confirmation, but it's also not such a bad negative divergence here so right now it doesn't seem like it will last very long, through the close easily and in to tomorrow's opening trade, probably, but beyond that we don't have any signals yet that would suggest more. That may be enough to make the QQQ breakout.
UVXY longer term 15 min which is leading positive, this would suggest confirmation of my theory that the knee-jerk move up is quickly reversed and we see some VERY SCARY downside, this is indicating someone is betting on a lot of fear in the market and there's only 1 good reason for that.
VXX (S&P VIX Short-Term Futures)-not leveraged. These are essentially the same as UVXY above, they carry the same signal/meaning and they were used yesterday as well to predict market movement.
VXX 1 min negative leading divergence, short term it comes down, market goes up.
3 min chart sees migration of the divergence, but again, not that bad of a divergence.
Longer term 15 min is also leading positive suggesting after a move up in the market (along the time period mentioned above) we will see a nasty reversal and downside move.
XIV (Daily INVERSE VIX Short-Term Futures)- These are the exact opposite of UVXY and VXX, so the signals are opposite, in effect XIV moves with the market.
1 min leading positive divergence suggesting intraday move to the upside in XIV and the market.
3 min chart also leading positive so there's migration of the divergence.
60 min chart is deeply leading negative , this suggests that XIV will see downside after the move above is complete and the market will see the same nasty downside.
That's 9 charts among 3 different assets, 2 different correlations and 4 different timeframes and all confirm each other and this is suggesting the exact move I suggested we would see not only last night, but the last 2-3 days in addition to the move predicted that already happened in the IWM and others.
Is interest rates about to start going up?
-
Yes, I know - it does not make any sense - FED is about to cut
rates...but....real world interest rates are not always what FED wants it
to be.
6 years ago


No comments:
Post a Comment