This is the 5 min SPY 3C chart, notice how today it was deeply leading negative, hitting new lows.

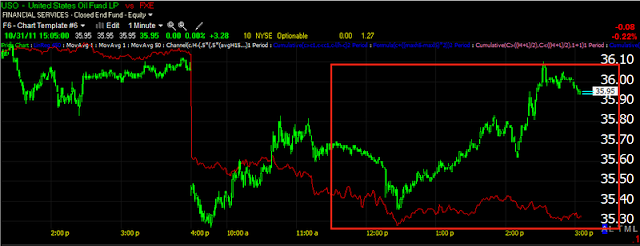
Here's a zoomed in chart so you can see where most of the leading negative divergence occurred, during today's lateral movement. My take on this, as we saw a few averages and USO trying to or filling the gap, is that smart money or at least the middlemen (market makers on the NASDAQ and Specialists on the NYSE) went in to the weekend carrying supply, meaning they carried shares in to the weekend long thinking perhaps that a Chinese EFSF agreement would be likely. Realize both middlemen as market makers can be short and even naked short. The absolute breakdown over the weekend and the resulting gap down today would have left the middlemen and perhaps even some smart money, at a significant loss on the gap down. This is why they would try like heck to fill as much of the gap as possible and if they couldn't fill it, they would go as high as possible and get as short as possible to make the losses up on the way down. I think that is what 3C is showing us as it made the bulk of the move down during the flat period that lasted most of the day.
I also believe that after the Yen Intervention and the way the EUR/JPY was trading, everyone expected the correlation to send ES up to nearly 1300, when that failed to happen last night, I believe the reality set in that this was no longer a legacy arbitrage trade, but a true Risk Off trade and understood that the market was not coming back today.
Friday we had the sym triangle which would have implied a break to the downside for technicians, but because Wall Street knows what technicians think, we see these false breakouts almost every time before a reversal and this one in yellow would have locked longs in over the weekend, which as you know, on a reversal creates a downside snowball effect with prices as we saw late in the day.
This is the longer term daily S&P-500 chart.
Here's a close up and what better place for a head fake then above the neckline of the top pattern, that alone is largely what drove Thursday's trade as traders will almost always buy a breakout that important, making it an area of great suspicion as we know how Wall Street operates.

Ironically it is nearly the same pattern I used as a comparison last week back in 2008, the descending parallelogram, a break to new lows in March just like we saw that kicked off the biggest rally in the entire consolidation. Note the break to new lows was also a head fake used to create a stronger short squeeze as you recall, we were predicting that weeks before it happened and then a rally to new highs. In the 2008 case, just as now, the rally ended only after it crossed above the H&S top neckline-just like Thursday and then back down and we lost about 50% from there. That post may be worth looking at again as the same principles played out exactly, just on a longer timeframe in 2008. Emotion still controls the market in the long run.

Here's one last indicator, MACD on a monthly timeframe. If you judged by almost any indicator available on a normal timeframe, today would never have happened and the only reason I show this (and it was sent by a member) is because it thinks outside of the box by using a monthly timeframe. As for the reason the typical indicators didn't work, I'm 80% sure it was because of Euro repatriation as we have discussed at leeeennngggtthhh. The indicators couldn't give a solid read because there were no technicals in the market, it was a first in which the Euro was inadvertently being manipulated and computers simply didn't understand.
In any case, Friday night I pointed out the rare candlestick formation of a Harami Cross reversal, which is stronger then a regular Harami reversal, today would be considered confirmation of that pattern, but remember there are no projections of downside, just a reversal of trend.
3C has shown a huge amount of distribution/short selling and why wouldn't Wall Street do so at the best prices possible. So I'm guessing if this turn hold, we are going to see the worst drop we have seen since 2009. We are now below the neckline, trapping bulls who bought the breakout, Europe seems more upside down then ever. We have to see some confirmation selling and get through the FOMC this week which as I already explained, I think we will.
I'll be back with more charts soon, I will say I am mentally exhausted or maybe emotionally? Quoting Dr. Seuss is proof enough!


