AAPL is another PCLN that people are itching to short, whether it's valuations, the loss of Steve Jobs or another reason, I get a lot of emails about shorting AAPL. In backtesting I did years ago, I found that best shorts were usually in the bottom 50% of sub-industry groups and for the most part, the stocks in the group that were the best candidates were in the bottom 50% of that industry group, in other words, AAPL is a strong stock and would likely be one of the last holdouts in a broad market decline so it's not a favorite for that reason alone. Secondly because of its weight it is used to manipulate the NASDAQ 100 and it is also a popular stock to buy and sell to balance ETFs.
Here are the charts...
This is the 1 min hart for today, I know there are a lot of positive/negative divergences and confirmation signals (white, red and green respectively) so I numbered them in chronological order so you under stand how point 1 led to point 2, etc.
The 5 min chart shows some weakness so intraday it may be something to keep an eye on although I wouldn't call it a strong short idea.
The 15 min chart showed a negative divergence that sent AAPL lower, since then it has been largely in line (green arrows) with price so there's no real edge there.
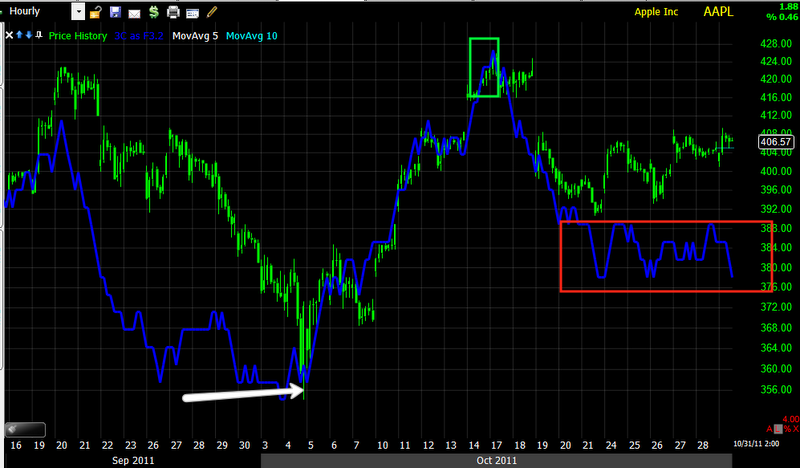
An hourly chart shows recent weakness in the form of a lagging 3C, pretty lose to leading negative, but there are a lot worse looking then this.
As far as the long term trend, it's still relatively stable, although there was a break in red and in white it's starting to get messy and trade toward the bottom of the channel. I would be interested in AAPL on a decisive break below the channel, especially on high volume.

The current pattern in price looks like a right angle Broadening top, every H&S top starts as a Broadening top first and a hallmark of a Broadening top is irregular volume where as a H&S has a very specific volume pattern. Also a Broadening top usually has 5 major points of contact between support and resistance, the last one will try to reach the upper channel and usually reverse and fail about midway, I count at best 3 major points of contact here and a lot of potential support zones. Right now, this doesn't look like a stock ready to just drop in a parabolic move and shorting it could be very frustrating in a very choppy environment. You might consider the next move to the top of the resistance trendline as an area to try a short as risk is more minimal there, but still I wouldn't expect a large move just quite yet.


 | Theme by Thur
No comments:
Post a Comment