When looking at a stock, I like to look at the long term first as well as the stock's industry and sub-industry group to see how they compare to the market and how the stock compares to its industry group.
Here's the weekly chart, DE is obviously turning down from an intermediate up trend
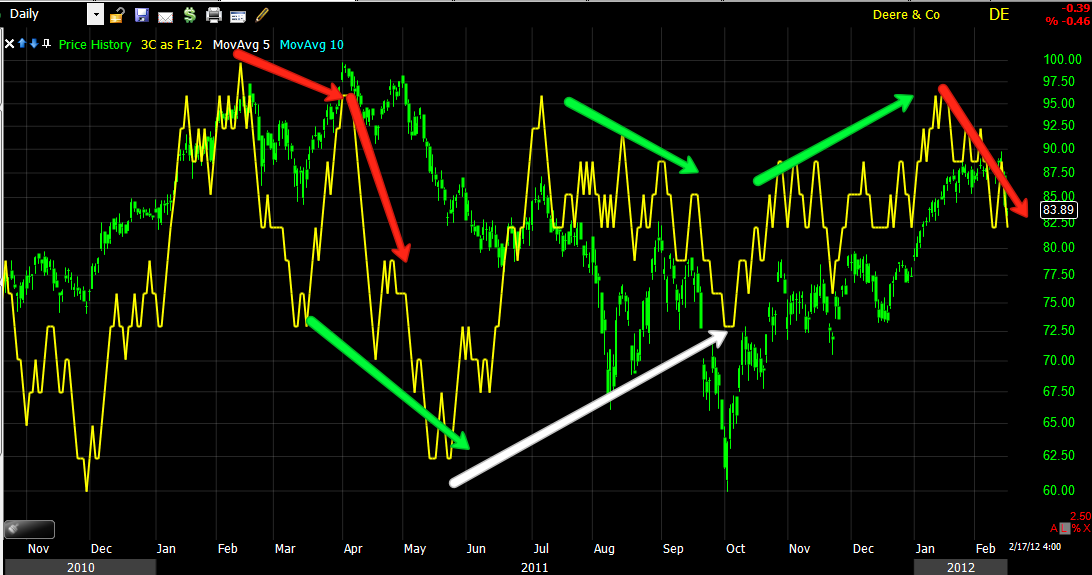
Here's the daily chart showing an RSI divergence meaning DE was warning it was losing momentum, when momentum is lost, it opens the stock up for a reversal and DE's break came on heavy volume and wide ranging candles, it was a serious break and counter trend vs the market which tells us there's real trouble in DE.
On a relative basis DE has underperformed the market since October, but even worse since the new year. Relative performance gives you a goo idea of the stocks you want on your watchlist whether you are looking for longs or shorts.
Here DE is compared to its industry group which behind market direction, has the strongest gravitational pull on the stock all things being equal. The Industry group has also underperformed the market. You can see DE's break with its industry group and it is one of the larger ones in the group.
The sub-Industry group also has underperformed the market and is reacting more then the Industry group as there are fewer stocks and DE is one of the largest. You may end up finding other stocks in this group that will suffer as a result of DE.
Following the recent move up, the Trend Channel has held the move without any breaks, although the close within range indicator has been showing gradual daily deterioration this year in DE.
On a daily chart, you can see all of the important accumulation/distribution areas and the last accumulation area that was large enough to give DE a solid run from October, there was confirmation at the green arrow, which recently went negative.
The 60 min chart shows the same with more detail, the lower timeframe charts will always be sharper and leak in to the longer timeframes, but a 60 min and daily divergence is a serious matter.
As mentioned above, the shorter timeframes will be sharper, like this 15 min which has been leading negative for weeks.
That weakness flowed in to the next longer timeframe, 30 minutes and distribution occurs in a flat area as it most often does.
Once the longer charts are sufficiently negative, we look to the short charts again for timing , this is a 5 min chart.

However, like I have shown you with real charts over and over again, a serious break can no longer reliably be shorted on the first break, three's almost always a volatility shakeout, we've seen these in different assets and the degree of the shakeout usually is correlated with the degree of how serious the break is, think about the Euro bounce after 41.30 was broken or even the move in the market now after nearly a 1 year top was broken, the bigger th break, the more it takes to change sentiment before the next leg down, someone has to hold the bag. This 1 min chart is showing some accumulation after DE broke -7% in 2 days, so expect a volatility shakeout/bounce before entering in any large size, although phasing in to a position is an option. These volatility bounces have been in the market for a long time in the major averages, there called bear market rallies, but in individual stocks, it's rather new and is Wall Street taking advantage of what technical analysis has taught for nearly a century, which is, "short the break down" or buy the breakout. You have to adjust, DE looks like a solid short, but if you are not aware and prepared for a volatility bounce, you'll be stopped out.

I would look for a move to the yellow area before committing in any size. I do prefer phasing in and having a little exposure in case there's a rapid change in the market, you at least have your foot in the door, but risk management planning must come before the entry and you must plan for the bounce.
DE looks like a great short, it's just a matter of patience to get the best entry given the market rules have changed.


No comments:
Post a Comment