One word, "Chaos". I keep coming back to the longer term charts and view as this is where I'm building the model portfolio position.
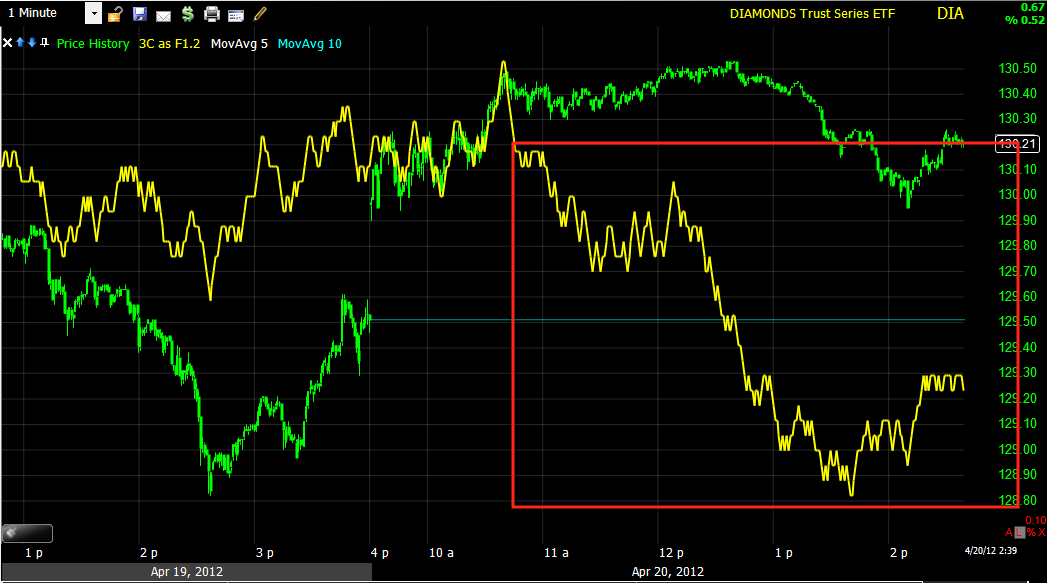
The DIA showing a nice negative 1 min divergence in to today's price strength
Intraday the DIA has the same 1 min positive as the SPY I just showed you.
The DIA unlike the SPY, although in a leading negative position, additionally has an intraday 2 min positive divergence at the same area I mentioned in the SPY.
The 5 min chart is leading negative badly.
IWM 1 min shows the same intraday 1 min positive divergence, it seems the market will try for higher prices in the last hour.
Although the IWM 2 min is also leading negative, it also has the 2 min psoitive at the same place.
The 5 min is leading negative, not horribly so, but it's there.
Finally the IWM 15 min is negative here.
QQQ 1 min positive divergence like all of the others, even though the underlying tone all day has been negative
Curiously the 2 min QQQ is showing a much stronger 2 min positive divergence that is leading at the same place as the SPY divergence shown in the last post, sector rotation ?
The 5 min is largely in line.
And the 15 min shows selling in to price strength in the Q's of which there has been little, but the 15 min chart here is looking more positive.
I'm going to look at the 3 pillars, Tech, Financials and Energy.
What has me a bit disturbed is the IBM positive divergence that appears stronger than an intraday move.
I'm wondering if the averages are going to come unglued with sector rotation also coming deeply unglued.


No comments:
Post a Comment