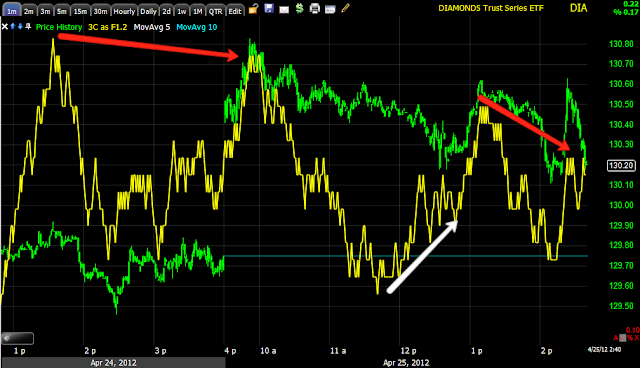
It is still not clear whether dumb money can be convinced that the policy statement in dovish enough to get the market higher. What I do see becoming more clear is negative divergences in to strength in price, this is what we want to see. I'm leaning toward adding more equity shorts with wide stops in case there are short term higher prices, allowing me to ride them out and add if the opportunity is there.
Here are some of the key charts that are making it a bit more clear.
DIA 1 min, the earlier positive divergence pre-announcement seems to show some choppy moves higher, each sees a negative divergence, again, price strength wherever it is found, appears to be under distribution.
2 min chart -the positive divergence here is less noticeable, this would mean it was not as strong, the negative divergences are quite clear, meaning they are stronger.
DIA 5 min, it doesn't look like an imminent collapse, so higher price are still looking like a reasonable possibility, meanwhile the "every person for themselves" concept seems to be alive and well as even small moves up are seeing negative divergences.
ES is relatively volatile intraday, also choppy, the trend in 3C is leading negative
Remember the Q's were the strongest yesterday, this is why (pre-AAPL earnings), the opinion was Tech would lead in the near term, AAPL confirmed that with their earnings. QQQ 1 min is seeing negative divergences.
The 2 min is quite clear, leading negative.
The underlying short term rotational strength in Tech is seeing some 3 min negative divergence, remember, it was the 15 min tech/QQQ chart that led me to believe tech would lead today, so the deterioration on the 3 min chart is flowing from the 1-2 min timeframes. The 15 min as the strongest in the QQQ, the 5 min will have to fall apart for the 15 min chart to start seeing the negative divergences which would be much more serious on the 15 min chart. As long as the QQQ 15 min chart holds up, higher prices in tech and thus the market to a lesser extent cannot be ruled out.
QQQ 5 min still holding reasonably well
Not much movement in the 15 min chart yet.
SPY 1 min, again the pre-F_O_M_C positive divergence and some pretty dent negative divergences in to higher prices.
The 2 min chart, again the recent highs have seen a decent negative divergence, indicating that strength continues to be sold.
3 min-same idea
The 5 min chart is falling apart here faster than the Q's, this is easily explained by looking at relative performance of Financials vs Tech, as expected yesterday the market would move directionally together, the difference would be in relative performance, Financials have clearly taken a back seat in rotation as expected yesterday to Tech, the SPX has a much higher exposure to financials and the Q's a much higher exposure to tech. Financials are even underperforming the SPX.
I want to keep a close eye on the market, but I would also like to be looking to add to short positions wherever there is decent strength.
Is interest rates about to start going up?
-
Yes, I know - it does not make any sense - FED is about to cut
rates...but....real world interest rates are not always what FED wants it
to be.
6 years ago


No comments:
Post a Comment