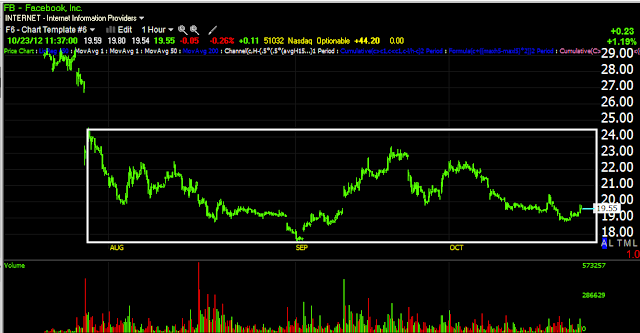
FB is reporting earnings today after the close, I will keep a close eye on it to see if there is what looks to be an earnings leak. Beyond that, I'm still focussed on FB as a longer term trade putting together a longer term base, earnings aren't of much interest to me because unless I see an earnings leak and we have seen a lot of those, earnings are a wildcard and it's the guidance that really matters and that often isn't discounted immediately, at least not like the headline report, usually guidance is discounted in the days ahead. One quarter about a year ago I wanted to show members that leaks are very real. I searched just about every company that was reporting, I wasn't looking for miss or beat, the charts can't tell you that; I was looking for the reaction after earnings based on unusual trade before earnings, we hit 19 of 22 correctly if I recall and GOOG we hit correctly except the GOOG signal didn't come until 15 minutes before the close and their report! So there are leaks out there, not everywhere, but when they show up, they are hard to ignore.
FB has had some unusual trade recently, I'm not sure I would call it proof of a leak, but if there were other evidence showing up today it would add credibility.
All the way back at the start of August, we saw a quick trade to the upside, but I said it would be short because FB was looking like it was going to build a large base (thus the upside trade couldn't go too far as a base would have to be formed), since then, that appears to be exactly what has happened. I'm not sure what I would call this price pattern and I don't think it matters, it's a wide range, but a range nonetheless.
FB acted well this morning vs the market, up at one point about +1.5% in early trade on volume.
Here's the recent rounding area where the market is expected to make more of a range. If you look at the FB range above and divide it up in to 5 sections and look at any one of those sections by itself, it's impossible to see the range or the bigger picture, that's something important to remember now (not that I would imply that a market range will be anywhere near this large).
1 min intraday FB was positive yesterday and early this a.m. on the gap down, it just put in a relative negative divergence that should pull it back.
This 2 min chart shows some unusual behavior with a very large leading positive in the area, however it's not that far off from the same seen in the market so it's hard to call that a sign of an earnings leak.
The 15 min chart overall looks excellent, especially since October.
Here's a closer look at the 15 min chart.
This is another unusual chart that is not seen in the market, a 30 min leading positive divergence, most market averages are around 10-15 min positives, but not leading like this and none are at 30 minutes, this is the closest thing I can see on the chart to unusual trade or a possible upside earnings leak.
I'll keep watching for additional developments.
Is interest rates about to start going up?
-
Yes, I know - it does not make any sense - FED is about to cut
rates...but....real world interest rates are not always what FED wants it
to be.
6 years ago


No comments:
Post a Comment