This is why I warn against getting TOO caught up in intraday trade or even day to day as you can rarely see the bigger picture unfolding right in front of you. 3C helps us determine what days like today mean for the market, for me based on what I've seen (evidence) the probabilities and signals suggested today's weakness was a gift I should take advantage of and I did in several areas. While the volatility of a range is near impossible to predict, it's the concept of the range or the process of a reversal. I don't think anyone could foresee the Market Watch article about the F_O_M_C's policy decision tomorrow and the ramping effect it would have on the market, however somehow that ramp had to be halted if there were to be continued positive divergences and I don't think we could have predicted the timing of Moody's yesterday (although I think it's not a surprise) nor could we predict how much the futures could be moved in low volume overnight trade, but the concepts still hold and as mentioned several expectations continue to unfold.
Now for the update.
FCT which was brought to me by a member has been an interesting leading indicator, on a short term basis it went negative at last week's top with 3C, but it is also going positive as the PX pulls back from last week's top.
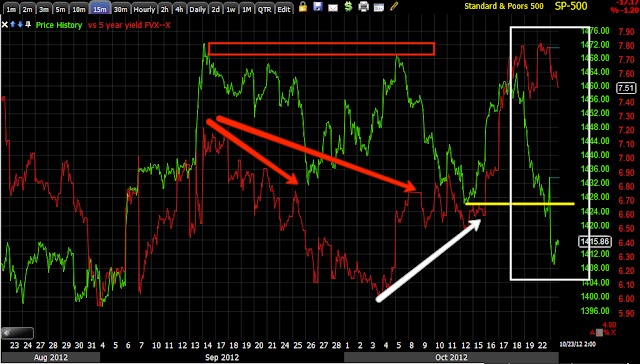
Yields shows one reason we most likely saw an intraday negative divergence in the last market update as you can see they diverge with the SPX.
Bigger picture on a 15 min chart though and we see the negatives at the last two top areas and a positive divergence going in to last week's top area and a continued leading positive divergence in Yields, these act like a magnet for the market so the bigger picture for the shakeout bounce/rally is still very much intact.
The $AUD intraday is in line with the SPX.
On a longer basis it went negative at the second top in this congestion area ann went positive before last week's top and remains in a positive divergence.
The Euro is a better confirmation indicator and intraday it was not confirming around the time the negative 3C intraday divergences formed.
Longer term the Euro was negative at the second top-not confirming, went positive at the lows before last week's top and remain in a positive area vs the SPX.
High Yield Corp. Credit (HYG) is following the SPX intraday.
Bigger picture it was negative at the second top of the 3, positive in to the lows before last week's top and still in a very positive divergence with the SPX.

High Yield Junk Credit is showing the same signals.
Sector rotation...
Just as suspected last Friday and the reason I held off on entering any financials, Financials in green at the bottom are rotating out as we saw start yesterday and Tech in, however we are now close to the point in which we may see that rotation start to reverse with Financials basically near the trough of the wave form of rotation.
Also interesting, Discretionary is performing much better than market price action alone would suggest, so are Industrials. Basic Materials which is loaded with momentum stocks was hit pretty hard today as was Energy, Energy is another that may be so low in the rotational scheme of things that it is near the bottom and ready to start rotating back in.
Alo interesting, Staples, Healthcare and Utilities, the Defensive Sectors or Flight to Safety Trade did not see very significant rotation on today's market action, really barely budged from yesterday, that is interesting and you don't see it often. My guess would be Flight to safety sectors including Treasuries (I do need to check them) are seeing cash flow rotate out of them and in to more risk on sectors.


No comments:
Post a Comment