I like FXP, I like China short, however FXP has too much of an inverse correlation with the market right now, I do think it will be among the first to break, but for now, China short is moving too closely (inversely) correlated with the market, thus this morning's drop allows me to exit the position at just about zero loss on the position or pretty close, depending on where the exit is.
While the FXP longer term charts look excellent in FXP, the short term charts are not there and this is a perfect example of an asset that is up this morning, but NOT seeing any short term chart confirmation.
FXP charts...
Longer term FXP should see a huge move up, I thin it will have to wait though for a market move up/shakeout. 15 min chart leading positive over a long period, a large base.
FXP 60 min chart with another large positive divergence.
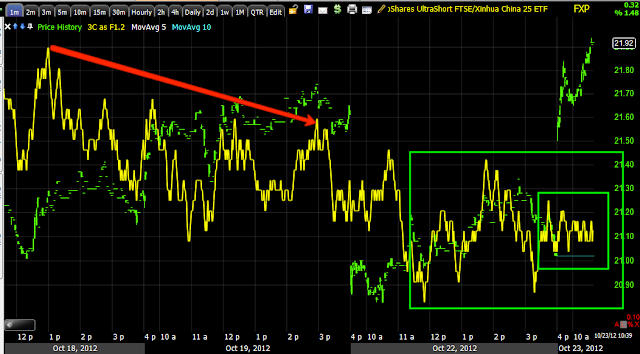
This is what bothers me right now and looks like opportunity cost as the 1 min chart didn't even move up to confirm FXP's gap up on the market gap down (remember inverse correlation).
The 2 min chart is worse.
The 5 min chart hasn't made any move.
In fact, looking at intraday trade, I'll probably be closing FXP now, for now, but longer term I'll be coming back to this one.
Is interest rates about to start going up?
-
Yes, I know - it does not make any sense - FED is about to cut
rates...but....real world interest rates are not always what FED wants it
to be.
6 years ago


No comments:
Post a Comment