So far this is kind of ideal, as I said many times, but again yesterday and
specifically last night,
Talking about the 50-day moving average and my gut feeling for how a move will play out from
last night's post...
"so I think this is something to pay attention to, especially any sharp upside volatility in the area as I have had a gut feeling that we will see that followed by a fast move to the downside and possibly seeing both occur on the same day."
The thing I like about the move so far this morning (within the context of expecting a sharp reversal to the downside and a bigger move to the downside before we see some accumulation and a real move to the upside with some staying power) is that it is large, intense, right around that 50-day and above the IWM range and it's VERY early, these moves are hard to sustain all day when they are this volatile this early as noted above, "a gut feeling that we will see that followed by a fast move to the downside and possibly seeing both occur on the same day."
The other things I like thus far,
Russell 2000 / IWM
Yesterday I had a feeling we were getting close to that move up in the IWM, I mentioned how the NASDAQ Futures looked better in the short term (while the longer term trend since last week continues to fade to the negative side) and how both the QQQ and IWM showed positive short term divergences that the SPY and DIA were not showing. Specifically when talking about the IWM yesterday, I showed you this 3 min chart that had originally went negative as the IWM put in a failed breakout from the range (yellow) and then recently has turned up to a stronger stance with a short term positive divergence. This led me to believe we'd see this move soon, as in today.
The fastest chart, 1 min has NOT confirmed the gap up open, nor have any of the other major averages, this is also what I wanted to see-distribution in to a suspected/anticipated head fake move above the range a the range was WAY TOO OBVIOUS not to be taken out.
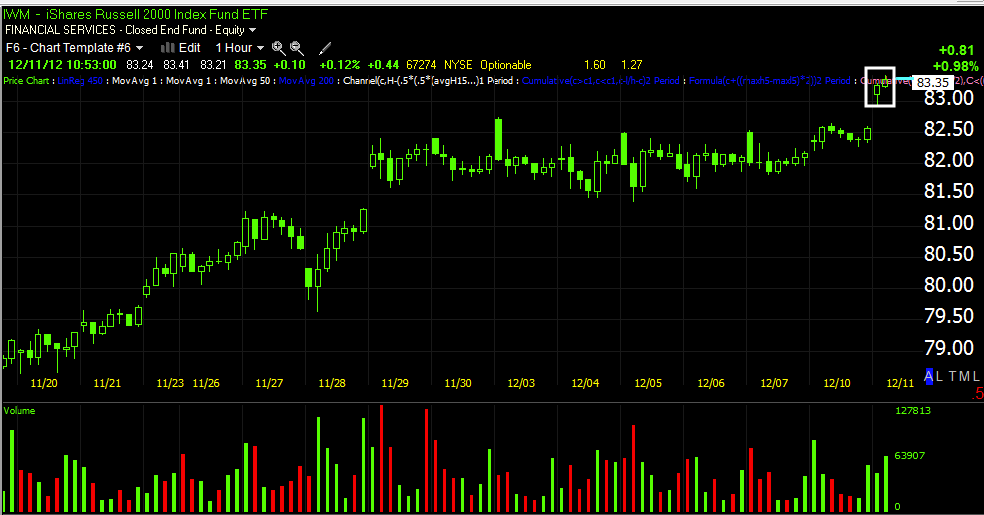
Here's the 60 min IWM, I don't even have to draw any trend lines, I think you can se the range and resistance that was in place and how today's move is a breakout of that range, I even called this expected move, "The IWM Breakout" move. So all of the stops and limit orders that have piled up there are hit, this can give the IWM momentum for a sharp reversal. Just as I showed yesterday in UNG, a failed breakout typically reverses very fast and very hard.
The Dow-30
The Dow-30 was struggling with the 50-day as of yesterday's close with a small candle with a long upper wick (loss of upside momentum and higher prices rejected intraday), so this move which I said to pay attention to last night as the 50-day is the 1 thing all the averages have in common and is the most watched moving average among technical traders, thus the easiest or most obvious target to manipulate, also sets up traders to move in the market, whether covering or placing orders or hitting limit orders, it has the same effect as the above in the IWM, it provides the momentum needed for a sharp reversal on a failed move.
DIA 1 min, like the others, no confirmation and in fact an intraday divergence which I warned about in the previous post.
NASDAQ 100
The NASDAQ lost the 50 totally and AAPL was a big reason why, so the fact they both shaped up together yesterday is no coincidence, with the move above the 50 ma today, it provides the same momentum talked about above for a hard reversal.
The QQQ 1 min with ZERO confirmation of the gap up, a very parabolic looking move so far which usually don't end well and an intraday negative divergence too that I warned about in the previous post.
S&P-500
The SPX was fading at the 50 day as well, yesterday it put in a very small bodied star which is a loss of momentum and sets up a reversal so this break above the 50 changes the dynamics in the minds of technical traders, it also opens a lot of avenues in which Wall Street can set the sheep up for slaughter.
The SPY 1 min with ZERO confirmation of the gap up and in fact a worsening leading negative divergence on the intraday chart as can be seen here.
NYSE TICK
For such a strong percentage move, the TICK chart (which is all NYSE stocks that advance per bar minus all decliners for the same bar) is not registering extreme highs as you'd expect, like +1500, instead it's been around +1000 on the extreme moves and in the +250 to +750 area the rest of the time.
The TICK is a good measure of intraday breadth, for the percentage gain moves we have seen this early, there's no where near the participation I'd expect, this can be accomplished by moving the most heavily weighted stocks in an average, like AAPL in the NASDAQ 100/QQQ. This is weak breadth when the market is being moved by heavily weighted stocks rather than seeing broad participation.
I just need to keep a VERY sharp eye on underlying trade, key stocks, other confirming assets and leading indicators.
I may be slow on email responses because it is essential I pay close attention to the market here, a great opportunity could pop up literally in seconds.


No comments:
Post a Comment