
Specifically High Yield Credit (credit is important because it often leads equities) performed a little better in to the afternoon, but was weaker on the whole vs last week, this is part of the divergence I have been watching for in credit and it has been forming up. Junk Credit performed better in to the close than Corporate HY, High Yield itself continues to build a larger multi-day negative divergence, a solid 3 days in to it.
Notably the Euro/USD and the market are coming unhinged from their normal tight correlation in which they move together (this has to do with the $USD and it's inverse relationship with equities and many risk assets including most commodities, but also reflects events in the EU as well as repatriation flows occasionally).
I always say I like the $AUD for a leading currency and the Euro/USD for a confirming currency, what we are seeing now is a lack of market confirmation as the EURO falls out of bed with the market correlation to form a negative divergence. I'd still think we'd see a stronger break above the IWM's congestion / lateral range, but looking at many of these indicators, it's not hard to imagine the market reversing quite quickly to the downside, the Euro alone is suggesting that and not a subtle hint, but a very noticeable divergence.
Yields have one of the most noticeable divergences among leading indicators, I haven't seen a divergence like this with Yields so negative vs the SPX and the market fail to revert to the mean (meaning move toward yields on the downside).
I mention the IWM's range being a obvious target, but another is the fact that all of the major averages have made it to their 50-day moving averages, which is also a widely followed metric. I mentioned earlier there could be several areas that are being targeted among each of the averages, but the 50 day is one of the most obvious and with all of the averages there, slightly above or just coming off, this is also probably not coincidental and wouldn't have been able to happen had the market continued lower as it was set to due before late Tuesday of last week, so I think this is something to pay attention to, especially any sharp upside volatility in the area as I have had a gut feeling that we will see that followed by a fast move to the downside and possibly seeing both occur on the same day.
The ;lack of movement is also creating ranges where a quick burst of upside volatility will grab attention and possibly set bear traps, did you know the S&P-500 has only moved +0.18% over the last 8 days!
Closing 3C for the most part, was not impressive, this taken with the negative divergence that was already in place and set to move the market lower before last Tuesday's bizarre support came in to the market ( since which the market has been fading) doesn't bode well for the market, it does bode well for our trend table- I still think 1 final sharp move up followed by a fast decline is probable.
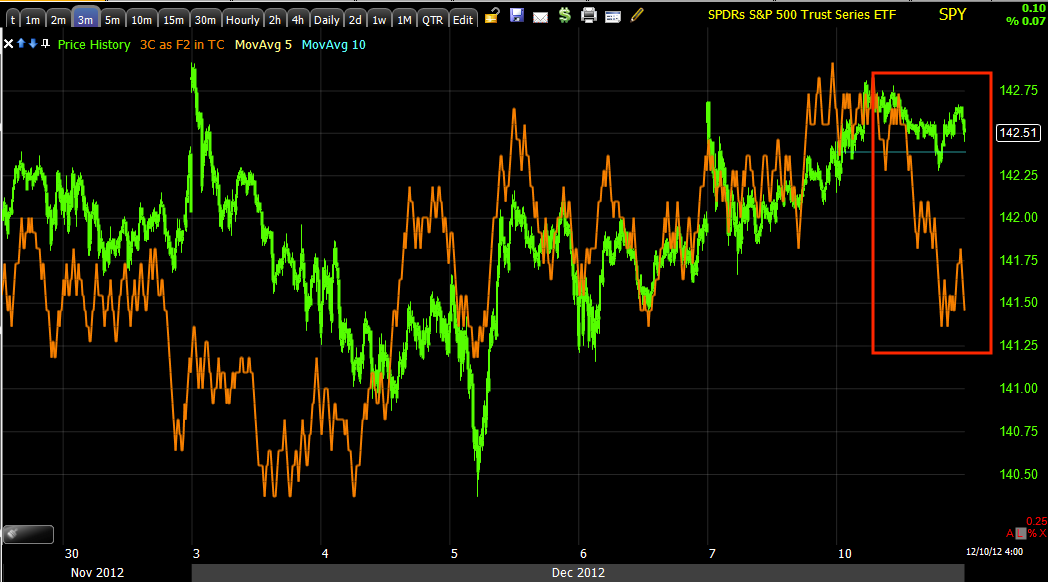
Here are some examples of 3C trade deteriorating along with Futures (the QQQ and IWM were exceptions today as was pointed out in many updates including NASDAQ futures).


So far the futures look like this in ES tonight...


The Euro has a positive divergence that could be part of the catalyst of this move I'm looking for, call it the break out above the IWM range move or whatever you'd like to, but as I said, volatile, but short lived and leading to a sharp reversal to the downside.

Euro 10 min chart with a positive divergence today suggests some upside which is supportive of the market, this is still near term and not longer term, the longer term charts are still in the negative camp and should feel that pull soon.
As mentioned earlier today, the NASDAQ 15 min futures look better this week (as early as it is) for the NASDAQ and I believe the IWM will also see a similar move.
Really, virtually nothing has changed since Tuesday in the analysis.


No comments:
Post a Comment