In any case of the 22 that I posted which direction I thought the stock would take (the after hours knee-jerk move is rarely the reaction sen the next day, in fact many times it's the exact opposite) as I have no way of predicting earnings, just what smart money seems to be doing, 19 of the 22 were correct; that's a pretty high average. Now to be fair, I probably looked at 500+ stocks.
I don't recall every catching Alcoa, although I did go back and check some previous earnings analysis and found short term negatives in July of 2012 with a longer term positive, AA fell to lows right after that and then took off to the upside in to September.
So I figured we'd take a look at AA today pre-earnings, but also to see if it said anything about the market overall whether it be in this particular move or earnings related movement, which may be what trend 2 is based on. I found some strange chart in AA.
 The VERY long term 4 hour chart is leading positive, this would be a trend beyond trend #2, it may be part of some signals that implied trend 3 up, which I was assuming might be liquidity or QE based, however the minutes may have changed all of that so if this is based on that, then this is open to change, I have no idea how much the market may have known or discounted about the minutes if anything.
In any case, that's a long term very positive signal.
At 15 mins we have the positive at the same place as all the other assets we looked at yesterday and a negative that is leading a bit deeper than the 60 min chart as would be the case if this was migration of the divergence.
Now starting from the other end, the shortest (1 min), there's a leading positive divergence suggesting AA makes a run higher probably before the close.

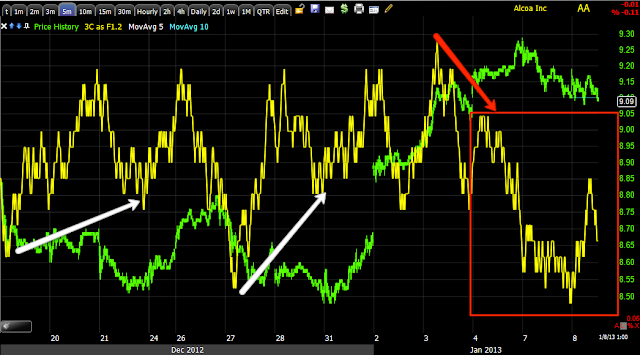
Here's where it gets strange again, the 2 min chart which was positive at both lows is in a deep leading negative divergence. I would guess this is pointing to an end of day sell-off or a sell-off in to tomorrow.
The 5 min chart shows the same thing, not as sharp, but it shouldn't be with migration of a divergence.
Being the 15 min is also negative, which I assume is positioning fro trend #2 as that has been the most common timeframe to see it, the only thing I get from this is a late day run up and likely downside after that, whether it is specific to AA's earnings or more of a bellwether, I'm not sure. I do like the looks of AA very long term, like investment long, but I don't think I'd be a buyer yet with these other signals in the mix.
If this is more indicative of the market response to earnings, then we may need to push up adding shorts , as I already said earlier, Financials don't look good. Lets see if we get some strength to dump the AAPL calls in to and see what happens with that strength (assuming we get it). If it dissipates quickly, I think I'd be moving toward adding the shorts I like.


No comments:
Post a Comment