First the S&P E-mini Futures (ES)...
You can see a lot of overnight action to the left, but what is important is right now with a relative positive and a pretty impressive leading positive divergence. NQ is still not showing anything that impressive at the moment.
Next the TICK data because this is something that you can use, they are good signals, just infrequent. This one happens to be longer than most and stronger as well.
SPY is in rd, note the trend to the upside in the TICk data, this is telling us more and more stocks are advancing as the market was moving lower, breadth on an intraday basis was becoming positive which is one of those things you just can't pull out of price and volume. The recent spike above the channel is a bullish event as well, nearly hitting +1000.
The averages...
DIA 1 min keeps improving, I still think it could use a little lateral consolidation, but then again we are looking for a move higher, but not a sustained move so it may not be that important to have a larger base to work off.
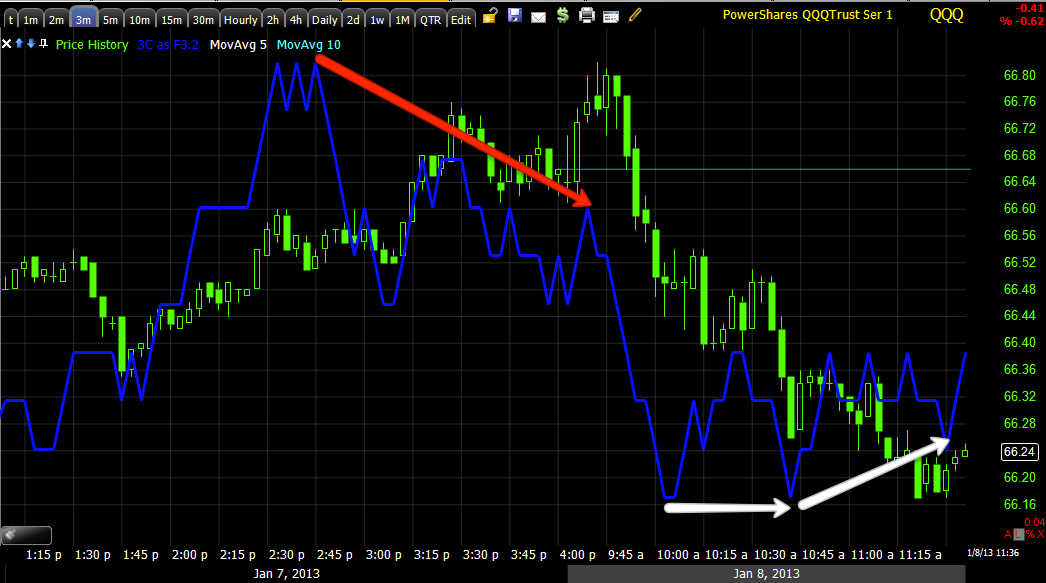
QQQ 1 min finally showing some respectable momentum in the positive divergence.
We're even seeing that now migrate out as far as the 3 min chart which was negative yesterday afternoon so it had to reverse that and now it's starting to move positive.
IWM 1 min still looking good as well as the 2 min leading positive...
Look at the 2 min SPY leading positive, that's a really nice change in momentum and migration from the 1 min chart below. In fact since the capture of this chart, this is now moving toward a new high on this chart.
1 min SPY positive divergence
Finally the Flight to Safety trade, Treasuries-TLT
The 5 min TLT is negative, we saw the 1 min negative earlier, suggesting the Flight to Safety trade is moving in to risk assets currently for the short term.
The 1 min TLT is looking even worse than before and starting to lose some ground in price. However remember that this is still a short term market move we're looking for, not a sustained move, the bigger trend is #2, which is negative. Look at the much larger, stronger and more important 15 min TLT chart below...
Just like in the volatility ETFs where someone has built a position, expecting some serious downside in the market, someone has built a position in Treasuries as a safety trade. Both are on longer term, more important charts and I'm sure both correlate to trend #2, which should be quite a bit larger and probably more intense than trend #1, at least more intense initially. You can see the difference in size when comparing the divergences.


No comments:
Post a Comment