So far the market has picked up exactly where it left off as far as the 3C charts go from yesterday.
In this post I described how the short term intraday charts among the major averages were acting in to the afternoon ramp attempt....
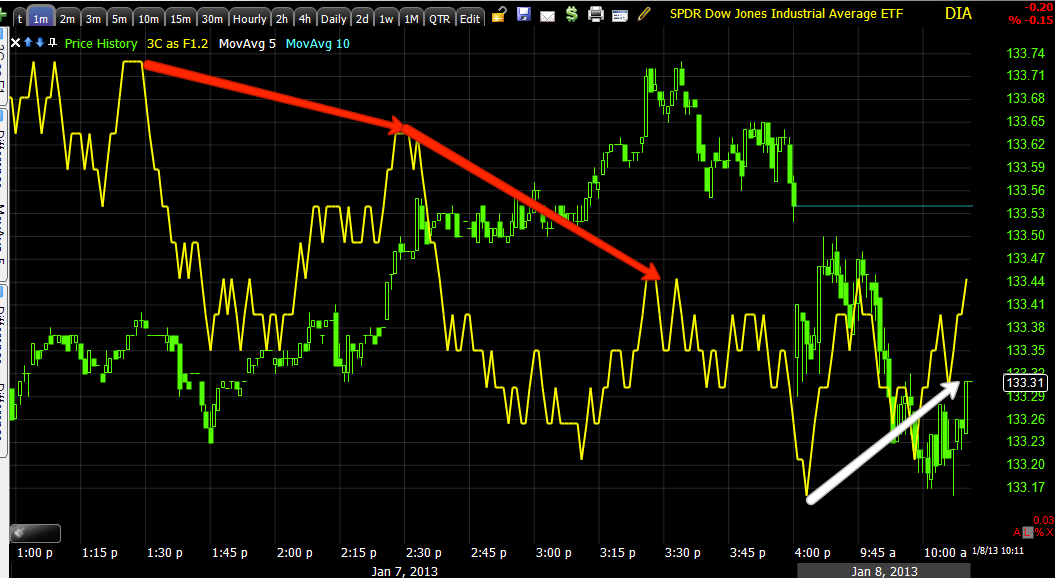
Here's a sample of the DIA...
"As for the averages, in to the close the DIA showed some distribution on the intraday timeframes, perhaps we see a gap down in the a.m., but there's still some support there in the 5 min range (overall a leading negative divergence, but within that there has been a positive divergence develop today), so that could lead to some upside late in the day so long as it holds which we'll watch as well."
All of the averages had basically the same short term story as you can see in last night's post.
Here's the opening indications picking right up where the underlying trade left off, with the early weakness described yesterday.
These are all 1 min intraday charts...
ES 1 min is in a leading positive position so I'd expect some upside as the a.m. trade burns off.
The DIA is showing it's first positive divergence, as to the description above of the DIA, the mid-day positive divergence that lifted the DIa did see afternoon negative divergences or light distribution, I don't expect that will hold though.
The IWM is in a leading positive position
The QQQ looks the worst as of now, the mid-day positive that lifted the Q's in to the afternoon also saw a negative divergence in to that lift, that' why I said I was expecting a gap down in early trade, but there are some longer term charts that are still looking supportive near term.
The SPY saw the same action and is in line this a.m. so far.
NASDAQ Futures also look pretty ugly intraday like the Q's.
However as mentioned last night as well (beyond the 1 min profit taking), there are still longer charts in the 5 min area that are still supportive of upside, so I'm not too concerned with early trade. If that changes I'll let you know.


No comments:
Post a Comment