There's not a whole lot to see that's too interesting right now, but I've had several requests...
ES SPX
1 min with some intraday relative divergences.
5 min, with a very nasty divergence in to the highs, a relative positive, this is what the current weekly calls are about.
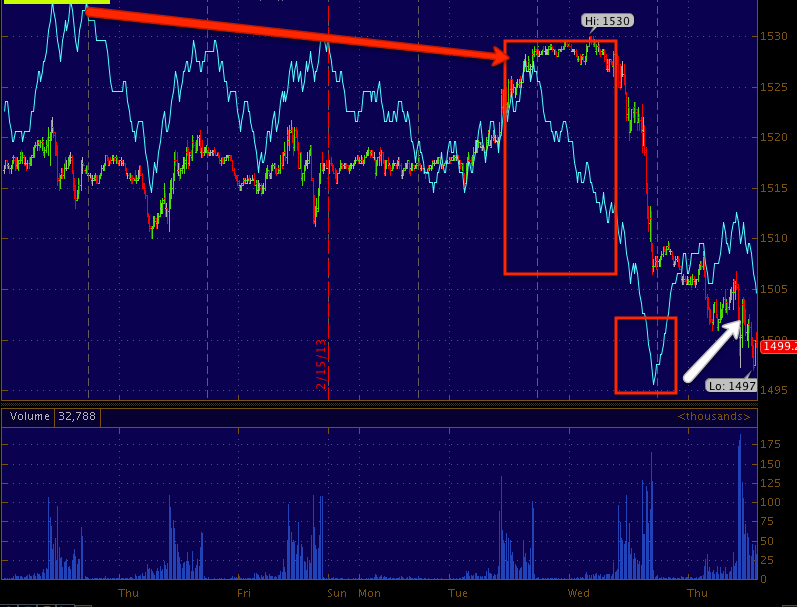
ES 15 min, this has been showing a pattern of distribution, it took that channel buster for large scale, all out selling in to it to break this apart. As I said earlier, there can still be lot of wiggling around and volatility, but the back of the trend is broken. I'm not sure I'd call the far right white arrow a positive divergence as it is still headed down and the 15 min chart obviously takes a longer time to move.
NASDAQ/ NQ
1 min is leading positive as I captured this, that's right after I posted the move in the TICK.

5 min very negative through the highs, a relative positive and leading positive, this is kind of why I favor the NASDAQ/IWM over the SPX/SPY in addition to the 3C charts on the averages as well.
15 min, you may recall late last Friday I was thinking about pulling the trigger on some calls and you can see the positive divergence late last Friday, I decided not too because of the G-20 and the 3 day weekend introducing a lot of uncertainty, but it would have been the right call to make, Again to the far right I'm not sure we can call this positive until the day finishes out.
A lot of damage has been done, but yesterday as the market was moving down, the "Buy the dippers came out in force if you follow the Twitter Stream, it went down lower and they averaged down; right now they'll need one heck of a move to get out of those positions if they are even still in them, the stream went quiet from what I understand implying they likely sold at a loss, but like with the GLD calls, sometimes it's just a little patience and I suspected that, that's why they are March month.


No comments:
Post a Comment