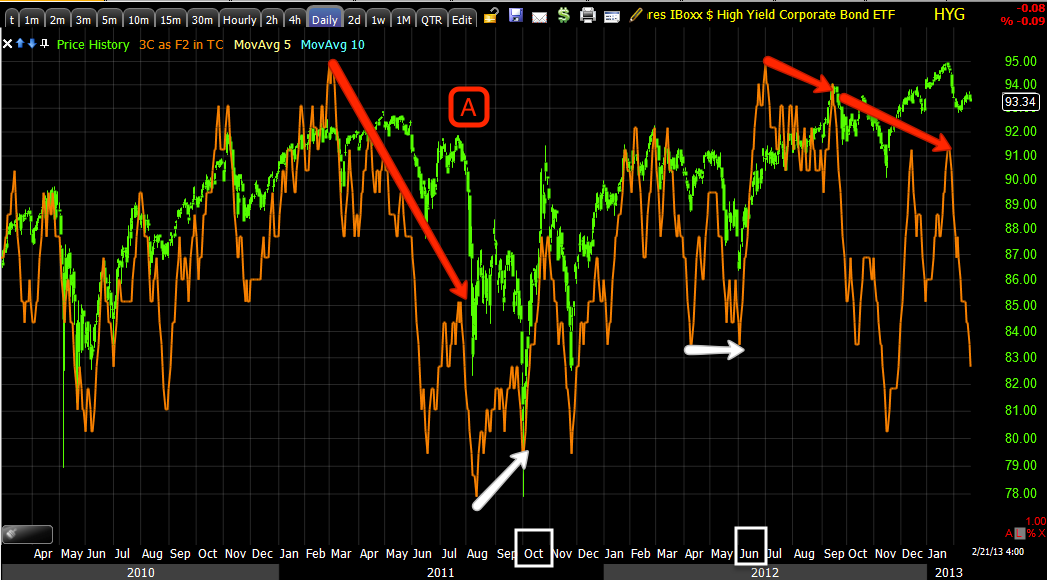
As for HYG (High Yield corporate Credit), I'm convinced the very recent uptick there (still in a major dislocation with the SPX) is one of two things, a short squeeze and a very liquid form of High Yield Credit that is exceptionally cheap.
It's really the divergence between Credit and the SPX that is the signal, but we can use 3C to see when credit is going to turn before we even get the price signal we use.
High Yield Credit is what we use for Leading Indicators, although yo could use IG if you could find a liquid enough form. A move to IG would be like a flight to safety trade and be bearish for the market if the SPX is rising and Investment Grade Credit is rising, this is why they are called "Leading Indicators", we don't want to chase anything, we want to get in at the top where the risk is lowest and the price is the best (for shorts-bottom for longs) and picking tops and bottoms use to be fool's game and still is for many, but we have some tools that give us an edge.
As for HY Corp.

One final point with the 5 hour (and thank you everyone for the emails on getting that timeframe on TOS)...

This is an excellent example of what I call the "Pendulum Effect", although rather small compared to what I think we will get when trend 2 (decline) kicks in, it shows the overshoot to the upside, breaking out of the Bollinger Bands, a clear warning and then as usual, the overshoot to the downside. This is why I say, "When coming up with a target, multiply whatever you think is reasonable by 2-3x".
So I do think we will see a move back toward the channel or median of the Bollinger Bands, the market wants to keep as many people wrong as it can at any one time.


No comments:
Post a Comment