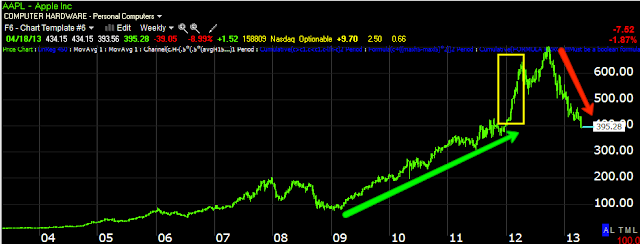
Here's the deal, I have long suspected that something bigger was going on in AAPL, the stock has seen a 300+ point drop and a loss of nearly half, - 44% over a 7 month period.
Look at a 5-day chart of AAPL and tell me which emotion that moves the market is stronger, Fear or Greed?
In AAPL's case, Fear and Greed were nearly equal, but this was an extreme case. It took 9 months to add on those last 300 points, but as I always warn, "Changes in character lead to changes in trends" and extreme upside volatility is almost ALWAYS seen right before a top forms so when you are riding a nice trend like UNG soon and in several years it breaks away from its trend to the upside, be happy for the gains, but know that the multi-decade party is coming to an end. Those same 300 points added in 9 months were stripped away in 7 months with virtually no break in the selling-Dan Loeb's Third Point Fund sure is influential!
The 1 min intraday chart, note the positive divergences and the lower price today from yesterday's divergence is a mere drop in the bucket when you consider the bigger picture, it's nothing.
However what do we have at the first two positive divergences yesterday that smart money filling big orders needs? Yep. If you answered "Supply" as the two positive divergences yesterday were both at the stop runs, you get the gold star. Today we have a more typical accumulation period of quiet in a tight range, I always say that, "Quiet markets are dangerous markets if you let your guard down, they are often like the kids in the room next door a little too quiet".
2 min chart shows the negative divergence at the EOD highs on the 16th and the stop move just before 1 pm yesterday is the start of a stronger leading positive divergence, today a nice tight range that allows market makers to fill institutional orders right at VWAP.
The 5 min chart, leading negative on 15th at the EOD.
15 min is one of my favorite timeframes, in markets that aren't extreme like this one, it's a great swing trade timeframe. Look at the leading negative last week and an equal leading positive this week.
Here's where it gets interesting because I have seen this, but I just haven't figured out the angle to make it a trade, there's a longer term divergence in play here on the 15 min chart if you zoom out. The white blocks are where the accumulation zones would be (primarily).
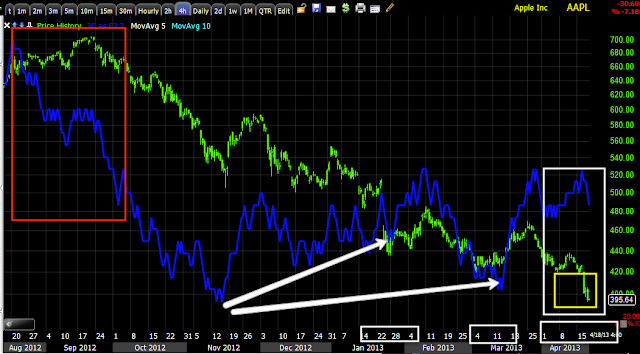
Now the 4 hour chart, just extreme selling, this is one of those times when Wall St. lost control and all funds tried to sell at the same time, too many big boys and girls trying to fit through the same small door at once and what started this? AAPL as a top 5 holding in Dan Loeb's Third Point Fund one week and then it missing from the top 5 the next week, all hedgies moved at once.
Smart money is a lot like dumb money in the herding mentality, if your fund underperforms the S&P by 15% it is not a problem just as long as 90% of funds underperformed by 15%. If you are a fund manager and making several million a year or a LOT more, you are concerned with keeping your job, not striking out on your own to try to stand out from the crowd because if you miss and standout from the crowd as an under-performer, there goes your job.
Intraday momentum is increasing, the momentum indicator on the top, RSI, MACD and even Stochastics
Is interest rates about to start going up?
-
Yes, I know - it does not make any sense - FED is about to cut
rates...but....real world interest rates are not always what FED wants it
to be.
6 years ago


No comments:
Post a Comment