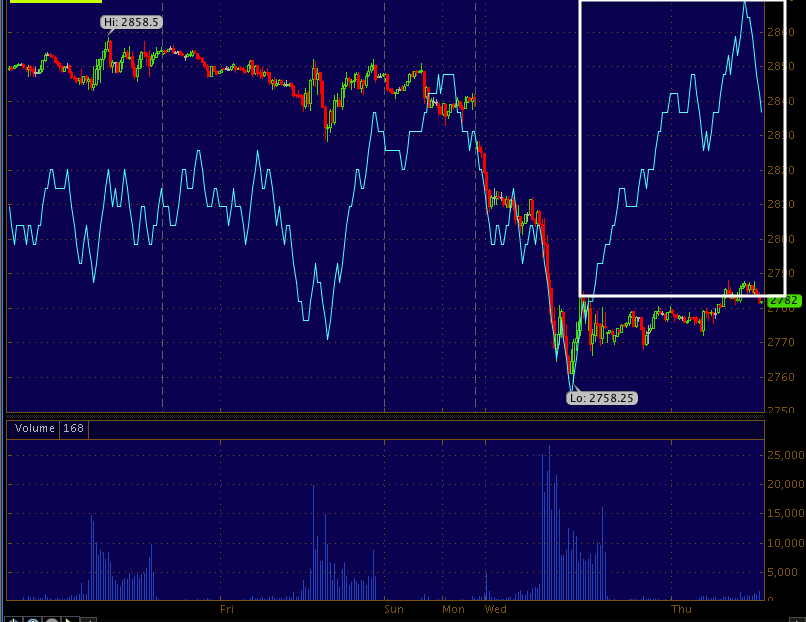
Here's a little deeper look at the Index futures, with 3C the fast charts like 1 min are intraday charts and helpful often with intraday moves, but as far as the real underlying trend, you are best off going to longer charts with less noise, as I often say with regard to using 3C, "When in doubt, go to a longer timeframe".
Here they are...
ES 5 min and all of the other 5 min charts really don't tell us much except there's at least an in line status coming off yesterday's regular hours market and a slightly more negative tone overnight so I have to go to longer charts like the 15 min.
ES 15 min shows the positive divergence for the short term move/base increasing, that's the underlying overall trend, although not detailed in the very near term.
NQ 5 min is a little more definitive in its strength, but still...
The 15 min chart's trend is very clear, very positive, that still doesn't help much with near term trade which we'll probably have to get from the market averages during regular hours.
TF for whatever reason seems to need 1 timeframe longer charts for the same results, it may be the version of 3C, but the 5 min tells us nothing.
The 15 min doesn't tell us much more
But the 30 min shows a strong leading positive divergence. Again, not a lot of help short term, but at least we know how the basis of this move is progressing.


 | Theme by Thur
No comments:
Post a Comment