I generally like to update the futures a bit later, I find they often don't do much right after the close as we have very deceptive, thin After Hours trade in the equities market and if Futures move during that time, much of the manipulation and game playing in AH trade would become more difficult if not impossible.
By later in the night the Far East markets are open (China and Japan) and economic information from both (which can be influential as China is the nominal Growth driver for the world economy and Japan is the 3rd largest economy in the world), believe me, I'd rather not be working at midnight, but if there's something to see, often that's the time to see it.
I'm going to show some trends that are a lot longer than what we are immediately interested in and although I wanted to get more done tonight, after this post I'm going to eat some dinner and go to bed.
You might have noticed that I wasn't especially aggressive today in taking on short term long positions, well I think I felt something that I mentioned later that may come in the form of some early weakness, taking out some stops and setting up a head fake move. The last 2-days trade was VERY easy to tell which way it was going not only from the Index futures, but especially the currency futures.
Tonight, that is not the case at all.
We'll start with CONTEXT for ES (SPX E-Mini Futures).
What stands out to me right away about this CONTEXT graph is 1) It's not very consistent in a trend 2) the dislocations either up or down are not very large, only about +8 / -6 ES points (
I'll remind you that right before last week's trend failed CONTEXT was negative -20, then -30 and then an unbelievable -40 ES points, actually a little more. I showed you that ES fell within about 3 points of what the CONTEXT model was predicting which was amazing.
Lastly I notice that overnight Tuesday we have negative readings which were used in lowering ES to the lows needed for the "W" base and during market hours CONTEXT is green and positive, not long after the close CONTEXT goes back to red which makes some sense with the short term charts.
Here are the Index Futures, I'm going to include timeframes I rarely include because I don't want to give you more to think about than what's right in front of us or what we need to prepare for, but in this case I think it's good to have perspective in trying to figure this one out.
ES (SPX futures)
ES 1 min (16 on the time scale is the New York regular market close).
There's no discernible trend in 3C or price, you'll see this in just about all of the short term Index and currency charts. The question of how we open tomorrow and how trade proceeds is a very open question. I am thinking 1) a bear trap with a head fake move 2) we just get some sloppy trade and then move up from the "W" base or 3) the "W" base grows in to a trade range-base (those are in order of probabilities right now).
ES 5 min shows accumulation at the first part of the "W" formation, a negative divergence bringing price down to the second low in the "W" which looks to be in line.
ES 15 min shows the negative divergence from last week's rally and a leading positive at the start of the "W" and a stronger leading positive at today's second part of the base with a head fake move likely put in at the yellow box.
ES 30 min last week's move in line, at the top distribution and a strong leading positive divergence in most of the "W"
Because the short term charts , especially overnight look like price is just trying to be held flat with minor adjustments, the price action in the a.m. remain a mystery beyond what we might expect from a head fake bear trap and a "W" bottom base.
NQ - NASDAQ 100 Futures
NQ 1 min there are positive divergences during regular hours, in overnight there are minor adjustments to seemingly keep price flat.
NQ 5 min shows a stronger leading positive at the second part of the "W" today as would be expected with a "W" base.
NQ 30 min Shows last week's trend with heavy distribution at the top and a strong leading positive at the "W" this week.
TF-Russell 2000 Futures
TF 1 min shows Tuesday night negatives or distribution sending price lower to the open, during regular hours- positive divergences and after hours/overnight more slight adjustments seemingly to keep price somewhat flat through the overnight.
TF 30 min Some minor accumulation in to last week's lows before the trend started, heavy distribution late last week in to the highs and pretty strong positive divergence this week in the area of the "W"
TF 60 min last week's trend in line, then distribution at the top and strong accumulation this week, presumably for our shorter term move to the upside, yet strong.
Currencies...
I'll remind you that
the Euro and the $AUD tend to trade with the market so
a positive divergence in either one suggests price will move up, following that logic
the market will tend to follow.
A negative divergence in either suggests price moves down and as such,
most likely the market follows.
The $USD and Yen tend (right now because the Yen correlation can change due to the carry trade or Japanese policy/economics)
to trade mirror opposite the market, so
a positive divergence in the $USD or Yen suggest higher prices for the currencies and typically lower prices for the market. A Negative divergence in the $USD or Yen suggest the highest probabilities are for
lower prices in the two currencies and as such,
this tends to be a market positive and the market tends to move up.
$AUD
AUD 1 min the red arrow below is the NY close today at 4 pm. There's positives during regular hours, this should be beneficial to the market, but overnight the same trendlesss price action and apparent 3C moves to keep it that way
AUD 5 min positive at the first base of the "W" and roughly in line today
AUD 15 min shows distribution at last week's market highs in $AUD and leading positive divergences this week in the area of the market's "W" pattern, should be market positive.
AUD 30 min the same trend from last week with distribution late last week at the market and $AUD highs with a positive divergence in AUD as well as the market this week.
AUD 60 min. accumulation early last week, distribution late last week and some accumulation this week.
I include some longer charts in other currencies, but because the Australian Central Bank is on the fence with policy for the rest of the year (they left policy and rates alone at the most recent meeting, but most FX traders expect 1 more cut of rates this year, some expect 2 more cuts this year, but it could be none). As such, the daily chart does not reflect any certainty.
Euro
Euro 1 min the same overnight trend-less market and 3C moves apparently to keep it that way
Euro 5 min in line trade the first part of this week and strong accumulation today with distribution at what would be the top of the "W" in the market or the middle of the "W".
Euro 15 min confirmation on the downtrend late last week, positive early this week and leading positive today, suggesting the "W" formation in the market and Euro is getting stronger.
Euro 30 min distribution from last week that is leading negative even this week, but a positive divergence this week in to the leading negative suggests the Euro will move with the market, but is in longer term trouble.
Euro 60 min basically the same as above, a leading negative divergence with some positives within it this week, overall though the Euro is very weak here which fits with the longer term market trend idea.
Euro 1 day-looks very confusing, but basically the Euro is growing weaker and weaker, distribution at "A" leading to a leading negative divergence at "B", higher prices at "C" with a stronger distribution signal and some modest strength locally short term.
$USD
USD 1 min green arrow is the open of regular hours, red is the close, overnight is leading negative suggesting some market strength. The negative divergence at the highs would equate with a positive divergence in the market at the lows today.
USD 5 min You have to look at this in reverse, if so, then it is supportive of the market making 'w' base.
USD 15 min
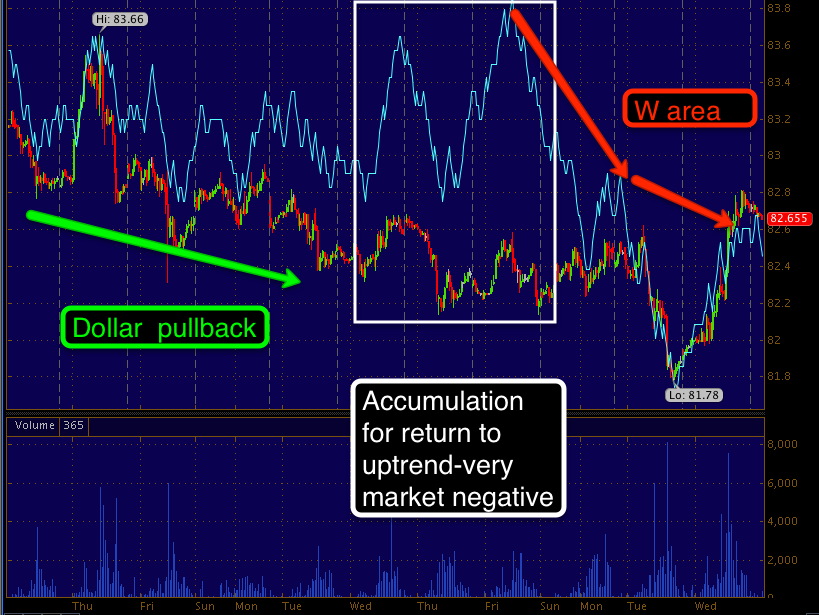
USD 30 min If you recall the Leading indicators and the longer term $USD trend, there was a move up and a pullback, this is part of that pullback that was showing some accumulation as if it is getting ready to end the pullback which would be very market negative, the more recent weakness is supportive of risk assets/market.
USD 60 min most of the $USD pullback, mostly trading in line/confirmation, the two positives are in the exact same area as the positives on the chart above.
USD 1-day A large overall $USD base, "W" or double bottom, it is near neckline resistance as it pulled back. "A" is the first high of the "W", "B" is the first low with a leading positive divergence, "C" is the second low with another positive divergence and "D" is the final high of the "W" and price is at the breakout zone, it pulled back right before a break out at 'E" and that is the pullback seen on the shorter charts above.
Right now what I get is the short term tells us nothing about immediate trade, we'll have to wait and see what new signals develop, but the recent trade this week on all the currency and Index charts is supportive of the market rallying in what I call short term, but it could be several days to a week perhaps at the size base we have now. It could add more to the base, I see this as very unlikely to fail without rallying first, but everything longer term looks very bad for the market, the $USD looks long term bullish which is very negative for the market long term or primary trend also known as a bear market.
If you see something I've missed, drop me an email. I see the market as almost certainly rallying on a short term move, everything after that suggests broad and deep weakness with deep structural flaws in the market or no support as the Euro looks very weak, the $USD is on the verge of a major upside breakout, this will put immense pressure on risk assets (the stock market, precious metals, energy, commodities, etc.)
I'll see you in a few hours, hopefully the near term trade signals clear up by then.


No comments:
Post a Comment