Of course after 4 F_E_D speakers this week so far with some highly unusual comments, we have the fifth tomorrow morning at 10 a.m., The Bernakanator himself. Is it just me or does it seem like there are a lot of F_e_D speakers this week pre-empting tomorrow's 2 p.m. release of the minutes from the last F_O_M_C meeting which was strange any way, "We could buy more, we could buy less", even though they have been slow boiling the frog since announcing QE3 to condition the market that less will be coming sooner than later.
This bit is boilerplate, whenever there's anything F_E_D related like a release or policy statement I always warn (because it's always there), "Beware the knee jerk effect". We see it so often that it's pretty much a mainstay, that could be useful immediately or it could be something to keep in mind, but if you go back to a F_O_M_C meeting from 3 years ago in the archives, you will see I warn the EXACT same thing EVERY TIME.
I saw something interesting today so I thought I'd bring it to you. You've heard of "Doctor Copper" before? In essence the direction copper takes is a leading indicator for the economy/stock market.

If you are still going on about Doctor Copper, then you probably took a few years off from trading, don't get me wrong, I think it is still useful, especially on the macro economic side, but Copper has been replaced by, "Dr. Wood". It seems wood futures are a much better sign post of economic and stock market activity.
Along those lines, here's Lumber futures vs the SPX in purple on a daily chart since 2009.
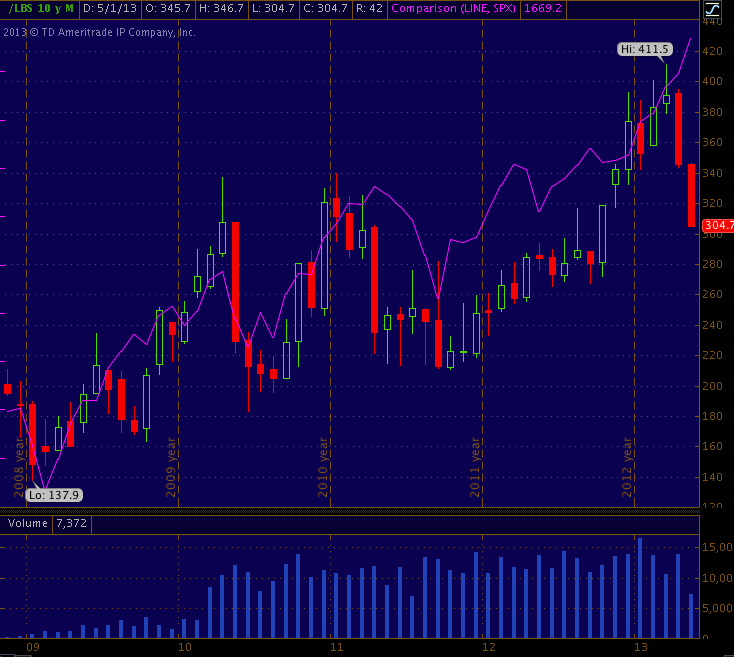
Now take a look at the daily chart of the same two assets...


Now remember last week I said, "We're going to have to pay more attention to Macro-Economic releases"? That's because any feeling in the market that the F_E_D is "ify" on QE or cannot be counted on to backstop the market, the market will front run like it did in QE1 and QE2 (market declined well before either ended), but in this case it "could" be worse because the market doesn't have calendar dates to reassure, things can change any moment and with index multiples like we have, Macro-data I believe will play a much larger role in reducing risk and bringing prices to a less "Disconnected" state with the real economy.
Keeping that in mind, take a look at Dr. Lumber vs the US Macro Economic Data trend.

As far as today goes, the market struggled, what else do you call a +0.05% close in the R2K?
Again, as as has been seen for the last two weeks very acutely if you pay attention, risk is sold, safety is bought. I didn't see anything that really ring my bell today, other than that increasing trend. Even if you don't have 3C or any indicators at all, it's plain as day on a price chart when comparing a risk and non-risk asset. This may be the first time in over a decade I've seen real support caused by real demand and not just some manipulation of technical tradewrs' expectations.
Here are a few examples...

If you saw (and you probably have), the longer term disconnect between the two, you might raise an eyebrow. We'll see more when we get to TLT.
However it wasn't just a bid for the safety of treasuries at work today, most of the entire risk asset class was going the opposite direction and considering the SPX only closed up 0.18%, these 12 ES points suggest the risk assets were really being sold, not just trailing behind.


It wasn't so long ago that the VIX was making 6 year, then 6.5 year , then 7 year new lows as the market went higher, you probably recall; that has stopped.

You may recall toward the close it looked like TLT was going to pullback with 1,2 and 3 min intraday negative divergences that were strong, as soon as it lost a little ground positive divergences jumped right in and again, any weakness in protective assets was bought, while strength in risk assets was sold.
Example...

The point is as TLT was seeing accumulation in to slight strength, IWM was seeing distribution in to slight strength, even without 3C you can see that by the IWM failing to make a higher high.


However what is most interesting about the VIX chart is the continuing pinch in the Bollinger Bands suggesting a highly directional breakout in the VIX, I doubt it's to the downside with all the VXX accumulation and if to the upside, that's fear and that send the market lower.

Note the Yen gains ground in the afternoon and the market loses it, the opposite occurred in the a.m.
Since 3C on the Yen was right on about the BOJ policy decision with a nearly 8 hour divergence before the announcement that was dead on, I'll be watching the futures for the yen and carry pairs closely.

I'll be putting up the futures as well as a few other assets that I think might be decent trade set ups.
I like the lateral motion in Silver and Gold, it's a process that they need to undergo, but the lateral trade is part of that process.
I also really like USO short, I'll be looking for any opportunities that open up (USO strength) to look for trades there.


No comments:
Post a Comment