OK, here's a REALLY STRANGE set of signals or more appropriately, "NON-Signals" from the market pre-F_O_M_C (usually we get something right before or right after), we saw nothing in stock index futures except the NQ 5 min chart I mentioned and nothing in the market averages, but we did see some curious stuff in currencies and the IWM looked a bit better than the others, this is still a mystery.
ES 1 min NOTHING Pre-announcement, at time of capture there's a slight leading positive divergence, it's still there, a bit more developed, not much larger in intensity.
ES 5 min, a very leading negative stance, there is what could be taken as a small relative divergence, but considering the lack of confirmation and nothing on the 1 min chart, it's not a good signal, not even average
NQ 1 min has seen a little leading positive since the announcement
This is the NQ 5 min chart I featured as the sole standout.
TF 1 min chart, the only thing close would be a 1 min "Almost relative divergence" which is the weakest anyway and it really wasn't because it would need to be at the same level on the right side (talking about 3C) as the left or higher and here it is actually lower. Since the announcement we see a small leading positive like the other charts.
TF 5 min went from a VERY NASTY negative to perfectly in line.
NO HINTS and even if there were, NO CONFIRMATION.
The Averages
DIA 1 min, the first white arrow to the far right is the odd 1 min activity I mentioned this morning
DIA 3 min, nothing.
The IWM, but this has been positive before, in fact I thought it would bounce pre-announcement
IWM 2 min seems to have a very small relative positive inside a much stronger leading negative that is also huge. Not a signal
QQQ 1 min shows the early 1 min odd activity this a.m. and is inline the rest of the day until capture.
QQQ 2 min leading negative
SPY 1 min perfectly in line...
Same with SPY 2 min
However....Currencies.
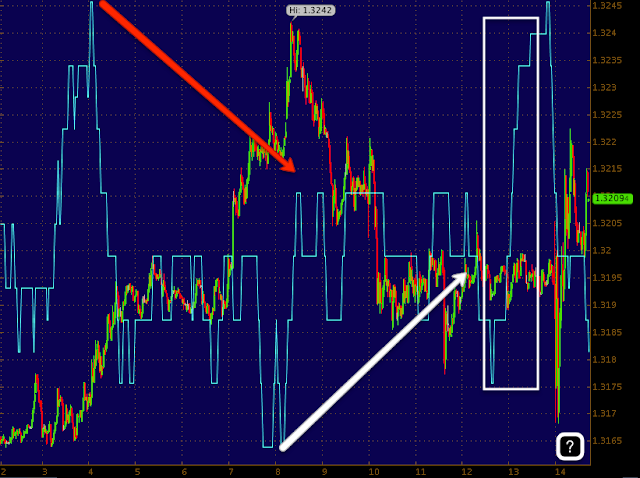
This was the Leading positive divergence in EUR/USD when I posted this about a knee-jerk bounce.
This is the same chart right now, the divergence/accumulation is still there, but it looks different doesn't it.
Here's the AUD/JPY which was one of the other pairs I mentioned in the post linked above, a relative positive in to the a.m. and a leading positive just before the F_O_M_C . There's a small divergence, but it's not negative because 3C has not turned down to lock it in, it's still moving up, I suspect it was enough to cause that lateral movement.
Now it's not looking as good.
We'll see what develops.
Is interest rates about to start going up?
-
Yes, I know - it does not make any sense - FED is about to cut
rates...but....real world interest rates are not always what FED wants it
to be.
6 years ago


No comments:
Post a Comment