With a falling HYG, only a falling TLT would neutralize that, we saw the divergence to send TLT lower yesterday, perhaps it was an effort to try to manipulate SPY higher, with TLT lower and HYG higher, it would be market positive, but HYG is losing ground and that seems to offset TLT losing ground which I think is a simple gap fill as HFTs leave no gap unfilled.
VXX (VIX Futures-short term) become the wild card, so lets take a look at all 3...
The SPY Arbitrage model has no discernible trend, this is because assets that make up the model are not moving in one direction for a trend, they are moving against each other.
HYG as I suspected and wrote about, did have gas in the tank for another run higher, but like earlier in the week, distribution of higher prices was almost immediate, that doesn't mean an immediate reversal, these are large institutional positions and not only may they be selling long exposure, they may be building short exposure. However now at least my theory from before HYG even moved up, that it would be sold immediately as there is strong risk aversion has been proven right both times we had a chance to see it this week.
HYG is losing ground today as well, this effects the SPY Arb negatively.
HYG 3 min shows the positive divergence that led me to say "There's still gas in the tank for a move higher", although on a very weak timeframe, again that divergence is being torn to shreds by the distribution, as you know, divergences migrate if they are strong enough to the longer, more important timeframes.
Now the 5 min positive which is as far as HYG's positive went is seeing the 3 min negatives migrate over and starting to destroy the "Gas in the tank", I suspect this continues today and HYG shortly continues it's move down.
The divergence between price of HYG and the SPX is already well past what we have seen in the past turn the market lower, but those were turns lower of several months, I believe the deeper divergence now reflects the deeper nature of the problem for the market.
TLT-20+ year Treasury Bond Fund
Note in white a bullish candlestick reversal called a "Harami" or as the Japanese call it, "baby inside mother" or as we call it, an "inside day", also note the second day of the pattern was also a bullish upside reversal "Hammer" as well with higher volume making it more dependable. TLT made a 5 week 1-day high on the gap up, but as we see, all gaps are filled now-a-days so it's not surprising that it filled today with a long upper wick yesterday as well as 3C divergences suggesting a gap fill, the divergences aren't large enough to represent too much more than a gap fill.
Here's TLT intraday filling to the closing gap, "All reversals see a head fake on the turn around", TLT saw one on a stop run just before reversing so I would not be surprised or alarmed to see TLT below the trend line, but it does need to start moving more laterally to accumulate.
TLT 5 min 3C chart shows the divergence yesterday in red for TLT to drop lower today, it was posted several times yesterday and last night, we do have a relative positive divergence which is a start, but still weak so I don't think TLT is ready to turn up, it needs more in the "Process" category, but I'll keep an eye on it.
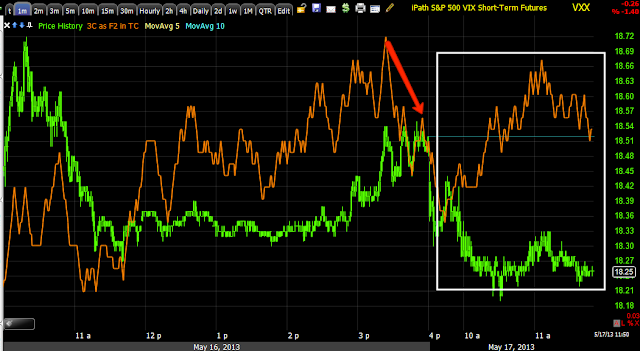
VXX headed down a bit which would be supportive for the SPY (arbitrage) if HYG hadn't lost ground, between the three, they are almost canceling each other out. However, VXX (VIX Futures) is showing accumulation of this move today.
VXX 2 min
VXX 5 min
This is the Yen (green) vs the SPX (red) inverse correlation we documented this week, it's for the most part in line. Yesterday, especially at the 11:30 move for the market to break out of the triangles, the Yen fell, allowing the market breathing room to make good on the upside breakout, but even with that and SPY arbitrage working for the market it could not make the move, I suspect it is the same as we have seen all week, sellers and not the normal sellers, this is the hedge fund herd moving in an every man for himself way, like AAPL's break.
Again today the Yen gave the SPY an opportunity to gain upside on a Yen decline, the SPY couldn't capitalize off it.
Of course this can be op-ex pin related, but being we've seen this all week and getting worse, I have to wonder.
One final thing possible, although I think unlikely, is the VIX/Bollinger Band, sell equities/buy VIX set up.
The VIX would have to close below the Bollinger Band and then pop back in to the channel, you have the market sell signal on that set up, but one other thing of note is the BB's compressing again, this leads to a highly directional breakout move-last time to the left we saw a couple of head fakes, then a directional move up. I do think it's interesting the BB's are squeezing again in this area as internal action has deteriorated significantly.
This is an extreme market, we don't see these very often, but it's also an unprecedented market, we've never seen this kind of globalization, this kind of global economic down turn and most importantly the F_E_D's moves since 2008 and hundreds of other Central bank actions, I believe we are up to nearly 500 worldwide since 2007 on the easing side!
We are trading a market with no historical comparison, this is all new territory, but some things won't change, such as human nature-Fear and Greed still dominate the market.


No comments:
Post a Comment