So what gives? How can I believe that we are at the point in which one of the biggest equity market bubbles that ever existed, with extenuating circumstances that can do nothing but make this worse than it already is (take for example the F_E_D's reduction of the growth of the balance sheet and heading in to a normalization of policy which has always led to bear markets) which I believe can cave in at any moment from where we are now, yet still close shorter term shorts and open short term leveraged long positions?
I am not a contrarian for contrarian's sake, I don't have a blue streak of hair or nose piercings to claim my independence form the crowd in fact this is a picture of me burnt to a crisp from the beach today while I look at the market with my Hungarian Velcro dog, better know as a Vizsla, I'm pretty normal other than some spiky hair that's probably several years behind whatever the latest fashion trend is (but I simply refuse to allow my mother to place a bowl on my head again and cut my hair like Justin Bieber's).

I digress as often must.
This weekend we were treated to Diane Sawyer telling us all that the stock market was in grave trouble. Other market aficionados told us that when the SPX closes like this, it means it's time to go even though most of these gurus have been telling us for the last 6 months that we have another 3 years of gains, then comes an ugly day in price and they are all singing a different tune. The truth is, the ugliness in the market has been astounding in how bad it has actually been, but we knew this a long time ago.
I have to say that I find this almost hard to type because I have been building the bearish market case for the better part of this year (and then some) with occasional splashes of long leveraged positions for quick trades on the upside for extra cash and to act as hedges of core equity short positions we have been building (I don't care if it's up or down, as long as we are on the right side of it), but I know that when the market really breaks (and I do believe the back of the market was broken around March and May 22nd's Key Reversal Day that I noted was further confirmation that we are standing over the edge of the waterfall) few will realize it and this is why I'd rather have those core equity shorts in place as most already are, if you've been here for more than a month, you know we aren';t in the habit of chasing price.
However as I noted after the close Friday, there were a number of one-off events that made the market perform badly, I noted them as you'll see below in this post from after the close Friday, "Moody":
"Today's market had nothing to do with supply and demand and and a lot to do with emotion, BUT, that wasn't all. In fact it was nearly a perfect storm between ignorance of events and fear of an event that has been at best, unreliable for the last several years.
Now understand, I'm about as bearish as you can get on this market, but we have to look at things as they are, not as we'd have them be and today was a really tough day to look at the market in that light.
Because this has been the worst month for bonds since 2009, The first issue I'm covering for today was managers in balanced portfolios. Because of the bonds/Treasuries performance, managers were forced to do a month-end rebalancing 'into' bonds and out of stocks to ensure the weightings remain with their mandates.
A big part of today's panic was the apparent spotting of the "Hindenburg Omen"
Another factor is that today is the last day of the month, Window Dressing. So we typically see portfolios tweaked here and there as part of the art of looking smart, window dressing use to be quarterly, now many funds report monthly.
Finally one of the most relevant events today was the MCSI Index rebalancing, in fact here's a warning from earlier about late day action today...
"Trading could become more volatile near the market's close because the MSCI indexes are slated to rebalance at the end of the day. Credit Suisse forecast $19 billion in total trading as a result of the rebalancing, with $15 billion related to developed markets."
"Trading could become more volatile near the market's close because the MSCI indexes are slated to rebalance at the end of the day. Credit Suisse forecast $19 billion in total trading as a result of the rebalancing, with $15 billion related to developed markets."
...You know I believe this market is going over a waterfall, but at the same time it doesn't do us any good to pretend something that isn't truly relevant to the market for more than a day, is taken as proof of our convictions that are fact based, in fact it cheapens them."
Now I can't say the market won't be down tomorrow, heck, I can't even say that this isn't the final straw, but I did open those long positions so obviously I'm not convinced this is the move.
Typically, as you know, a reversal is a process, not an event so even if the market were to reverse to the upside before it finally breaks down, this chart would suggest the market has some more downside and some lateral or rounding bottom trade ahead of it, that's if I'm correct in thinking Friday wasn't what it seemed because of the confluence of extraordinary events.

THE POINT WAS THOUGH, THAT EVEN IF THERE'S A REVERSAL TO THE UPSIDE BEFORE WE GO DOWN, IT'S USUALLY A PROCESS AND WOULD SEE MORE DOWNSIDE AND NEED TO TRADE LATERALLY TO SOME DEGREE.

THE other thing we know is before any decent reversal, at least 80+% of the time, there's a head fake move, would we have a reversal to the downside this big without a head fake move? It is possible if Wall Street panicked and a selling stampede began, but it's just as possible that we are seeing a Crazy Ivan head fake move, first to the downside, then clear the baffles to the upside before the real move breaks lower.
One chart that tells me the market "Could" reverse to the upside without the need for a reversal process is this one.
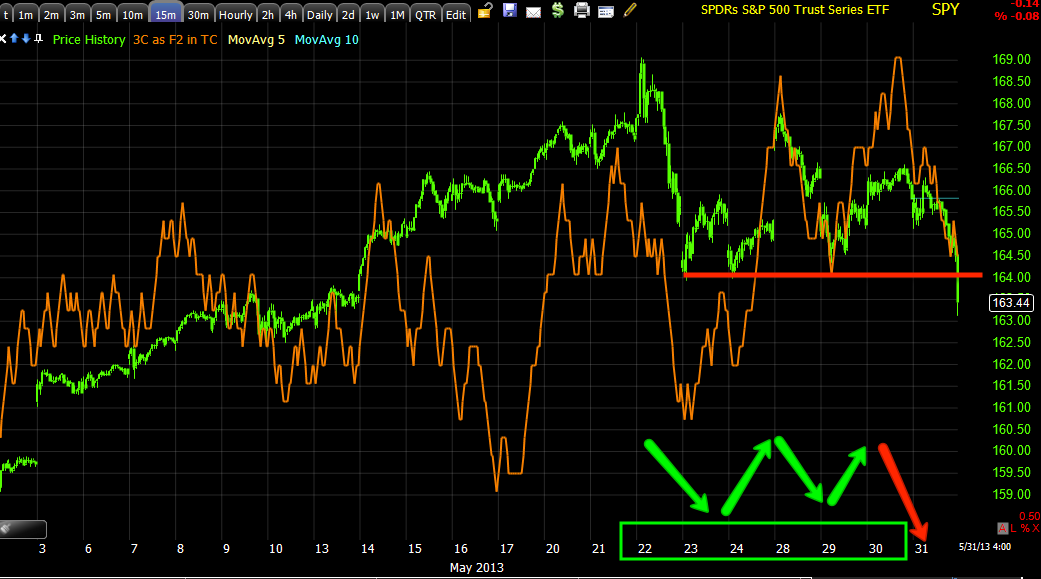

If we look at the 15 min 3C chart, if there were heavy SPY distribution causing Friday's decline, the 15 min chart could have easily shown us that, it's not often the chart moves this quick, but we have seen 1-day break downs in the chart and with price acting as it did, if smart money were really panicked, I'd expect to see the 3C chart negative, not leading positive still.
A few other charts bothered me as well as far as the legitimacy of Friday's move...


The 30 min chart in recent perspective leading positive, sure a shakeout below the red trendline would be what we'd normally expect before GOOG headed higher, but GOOG should have looked bad, not like a decent long.
If there's one thing I've shown you over and over again and seems to be the only real correlation moving the market recently, what would that be? It would be the Yen or more importantly, the only carry trade that hasn't collapsed yet, the USD/JPY which has had nearly perfect 1.0 correlation with the market so if SPX futures (ES) looked like this...


did the USD/JPY, the only currency pair that moves the market fail to make a similar lower low?
This was the most difficult aspect to reconcile and I can't.
As for futures tonight...


How about Crude's 5 min chart, that looks pretty darn positive like Energy is about to make a run to the upside, that doesn't fit very well.
So what about the USD/JPY?

So far on the open for Sunday, it has a pretty positive look to it.
If the USD/JPY were to head higher, that would be short term bullish for the market, the $USD would have to move higher (it doesn't make sense with crude, but this is one of those times that the Yen and USD/JPY have a stronger market correlation than do the Euro, $AUD or even the $USD alone).
So the $USDX futures tonight?


The 5 min is leading too.
Don't get me wrong, if we're going down, I'm happy to see it and the core positions are all set up already for the bigger picture short trade, but there are some things that just don't sit right with me.
Whatever Diane Sawyer knows, everyone knows and what everyone knows has no use at all to me.
Tomorrow should be very volatile, I'd think we'd see a plethora of sell orders from 9-5'ers catching up over the weekend in the early going, this is where we'll find the information we need. In fact all of tomorrow will have a lot of important information for us.
I just want to take the market as it is, not as I'd like it to be as I've been building the case non-stop for a long time, it doesn't do any of us any good to just look at things the way I'd like to see them, we have to look at them as they are and that's where we find our edge.
I have no doubt this market is "Dead man walking", I just question Friday's move.


No comments:
Post a Comment