Chinese Exports were releases just about an hour and a half ago, the y.o.y. performance was the worst in nearly 4 years, the consensus was for a +3.7% gain, the actual came in at negative -3.1%, suffice it to say this was a huge miss to a very important data release (at least it's very important now). For more on what this means
I'm directing you to Bloomberg.
There are however some curious charts. You may recall earlier tonight I mentioned the AUD/ JPY currency cross and how the single currency futures weren't looking very good for this driver of over night market risk, there's the AUD which was effected as well as its other pairs and futures, I just took a quick look and found some charts a little interesting.
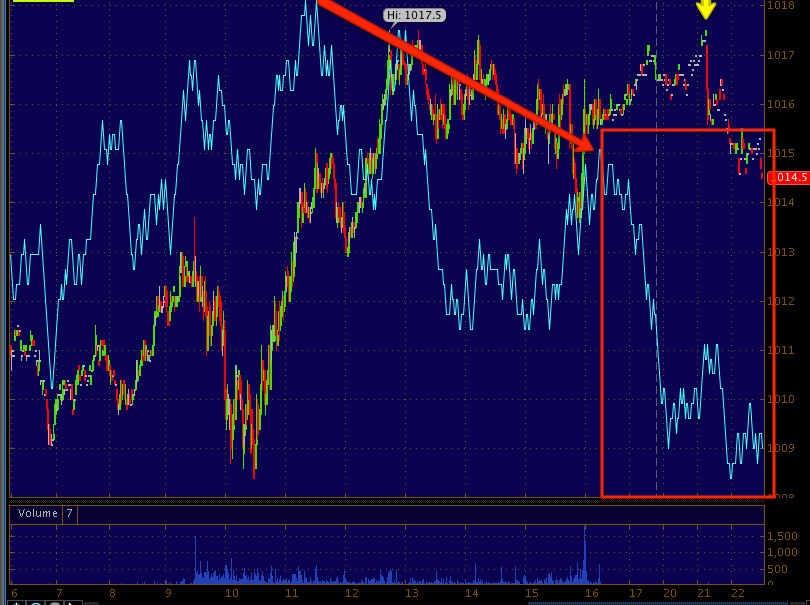
The yellow arrow is when the data was released.
This is the AUD/USD 1 min chart, that's a pretty sharp decline just before the data was released as well as a sharp decline in the AUD which is very sensitive to China obviously, the single currency futures show a lot more detail.
AUD 5 min, I noticed earlier and thought mentioned it tonight as the AUD/JPY pair was unlikely to be the force behind an overnight futures ramp as last night and the market followed the pair very closely through the day as well.
I didn't associate the size of the decline in #C with anything at the time other than the pair likely heading lower, but that is a new leading low for the week and a lot of it was after hours alone.
AUD 15 min, again one of the charts I saw earlier and thus mentioned, again another leading negative low for the week in a rather short period of time.
The 1 min Russell 2000 futures, you can see the size of the decline before the data release.
R2K 15 min chart as well
The 5 min NASDAQ futures had an especially interesting divergence before the data release, in just about every case we have new leading negative lows for the week and almost all created since the market close.


No comments:
Post a Comment