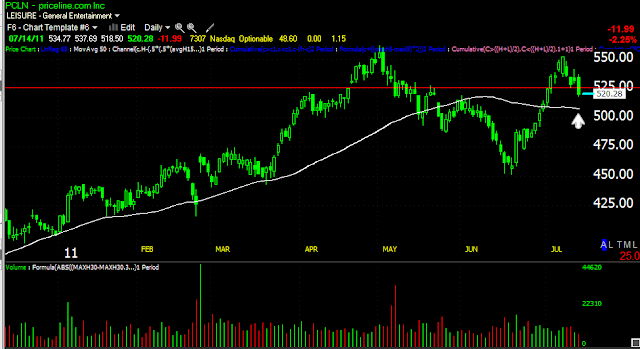
Here's yesterday's update on the PCLN short trade
And here we are today, having made a substantial step in the right direction.
Yesterday I defined this red trendline as the next step in PCLN's journey, the break on the trendline represents a new low and a downtrend is lower highs, lower lows as you can see by my annotations above.
This daily chart was part of the catalyst for the trade idea, 3C showed a false breakout.
As you can see, yesterday we had a negative divergence suggesting PCLN would make that lower low today as it has, but we also have a positive divergence and the trendline is likely to be gamed a bit over the next few days.
Here's the 1 min positive divergence today, so I expect price to move toward the trendline.
The next significant move for PCLN will be to break the 50-day moving average. There' nothing special about the average except that trader's and thus Wall Street pay attention to it. At this point you should have about a 5% gain on the trade since it was mentioned. You may want to lock that in and re-establish the position or just ride it out.
You can also use the Swing trend identification.
The red candles are the trend, lower highs/lows, the yellow candle is noise in the trend. The swing downtrend would be broken with a losing candle that has a low higher then today's high as today is the new signal candle, being the last in the series to make a lower low/high.
Is interest rates about to start going up?
-
Yes, I know - it does not make any sense - FED is about to cut
rates...but....real world interest rates are not always what FED wants it
to be.
6 years ago


No comments:
Post a Comment