To tell you quickly, I don't see much as far as high probability opportunities, but there are charts below I think you should see as a way of understanding what's going on in the process and how it has changed even more than I'd have expected and particularly today.
The Q's don't seem to offer much right now.
3 min QQQ is showing what's been going on there, note today at the far right.
The longer 30 min chart
And even a 60 min chart's decay that starts very sensibly from our perspective right around a head fake move (yellow).
The SPY...
All of the charts from 1-5 min intraday are either in line or negative so there was no need posting them, but do look at the 5 min chart within the context of its trend below...
I don't even need to make any notations.
And the increased downside 3C momentum is all the way out to a 30 min chart here on a short term basis, this is really ugly.
The IWM... I don't see any high probability long opportunities here either...
I used a 1 min chart because it's the fastest, the most sensitive and it shows in the yellow area there was no positive divergence to drive price at all and we are seeing a negative divergence in the IWM on the +0.20% price move today and the divergence has migrated intraday to the longer charts as well.
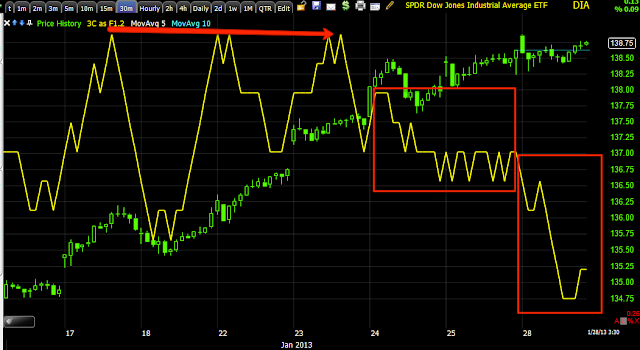
Finally the Dow/DIA...
I mentioned the DIA earlier as having the best looking intraday chart, this is barely a positive divergence and a relative one at that, but enough to move the DIA and 3C is in line with that movement.
The 2 min chart had no sign of the same positive divergence so apparently it wasn't very strong.

The 3 min chart shows about where the short term lid is on the move.
However what is really important and interesting is the rate of decay in 3C on important timeframes like 10 minutes and this action being very close to either today or a little Friday and moving through today as well.
Take a look at this rate of change in 3C on a 30 min chart and that definitely started Friday, but rally picked up today.


No comments:
Post a Comment