We have the intraday reversal that I've been looking for today, I just wanted to show you a couple of ways you could have predicted this as well without 3C and without the same indicators that everyone else is looking at,
if you want an edge in the market you have to see what the crowd missed.
Granted, RSI is a fantastic indicator for this task, but if I'm using conventional indicators, I want confirmation from multiples and in an unconventional way, then I'll show you a simple custom indicator that can be used effectively.
3C showed me pretty clearly an in a number of assets, this is one I just grabbed because I thought I'd stay with the SPY theme, but other averages warned earlier. A positive to the left as hoped for yesterday and a negative intraday to the right as expected today.
My Oscillator Screen is conventional, but in an unconventional way. I use momentum on price, RSI 6 below that which is half the normal RSI setting, then MACD 26/52/9 which is twice as long as the conventional setting and then Stochastics period 50 which is about 4 times the conventional setting.
The trick is to use these in multiple timeframes and you can really start to pinpoint what is a move, what is important, what is part of something else, like this move down appears to be part of an overall bullish move to come so having that perspective gives you a lot different perspective as to how you want to use price movement.
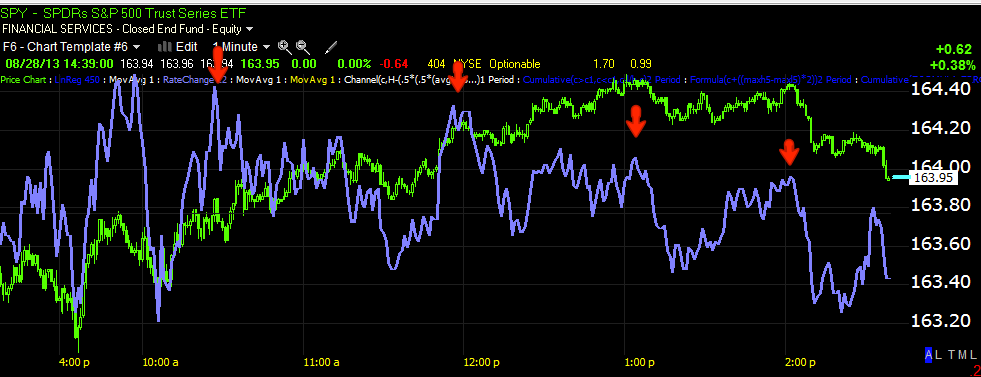
Of course the NYSE TICK vs the SPY in white and the channel, it's effective, but few know of it or use it.
I created my own custom TICK using NYSE TICK data vs the SPX with linear regression.
How about this, the long lost and forgotten
Rate of Change, which is an indicator that enhances nearly any indicator you apply it to.
In this case I couldn't apply it directly to price, although it does a good job of showing the divergence so I added a 1 bar moving average which is no smoothing at all and added the ROC to the 1 m.a. and made the m.a. invisible.
How about this, a 50-bar moving average on a 5 min chart, then below a custom indicator in blue which is simple (Close-Average Close 50 + Close 1 bar ago minus average bar 50 1 bar ago) and then I applied a 22 bar moving average to the plot, it gives a great reversal signal at the crossover.
This is simply taking advantage of the change in character of price vs its moving average, CHANGES IN CHARACTER PRECEDE CHANGES IN TRENDS.
Any way, I hope this helps get the creative juices flowing, you never know what you'll come up with.


No comments:
Post a Comment